There’s an old story about a drunk trying to find his keys in the streetlight. Why? Well, because that’s where it’s the brightest. It’s a funny story, but also relatable, because as humans we all tend to take the path of least resistance.
I think we have the same problem in the web performance community. There’s a huge focus recently on JavaScript bundle size: how big are your dependencies? Could you use a smaller one? Could you lazy-load it? But I believe we focus on bundle size first and foremost because it’s easy to measure.
That’s not to say that bundle size isn’t important! Just like how you might have left your keys in the streetlight. And heck, you might as well check there first, since it’s the quickest place to look. But here are some other things that are harder to measure, but can be just as important:
- Parse/compile time
- Execution time
- Power usage
- Memory usage
- Disk usage
A JavaScript dependency can affect all of these metrics. But they’re less discussed than bundle size, and I suspect it’s because they’re less straightforward to measure. In this post, I want to talk about how I approach bundle size, and how I approach the other metrics too.
Bundle size
When talking about the size of JavaScript code, you have to be precise. Some folks will say “my library is 10 kilobytes.” Is that minified? Gzipped? Tree-shaken? Did you use the highest Gzip setting (9)? What about Brotli compression?
This may sound like hair-splitting, but the distinction actually matters, especially between compressed and uncompressed size. The compressed size affects how fast it is to send bytes over the wire, whereas the uncompressed size affects how long it takes the browser to parse, compile, and execute the JavaScript. (These tend to correlate with code size, although it’s not a perfect predictor.)
The most important thing, though, is to be consistent. You don’t want to measure Library A using unminified, uncompressed size versus Library B using minified and compressed size (unless there’s a real difference in how you’re serving them).
Bundlephobia
For me, Bundlephobia is the Swiss Army knife of bundle size analysis. You can look up any dependency from npm and it will tell you both the minified size (what the browser parses and executes) as well as the minified and compressed size (what the browser downloads).
For instance, we can use this tool to see that react-dom weighs 121.1kB minified, but preact weighs 10.2kB. So we can confirm that Preact really is the honest goods – a React-compatible framework at a fraction of the size!
In this case, I don’t get hung up on exactly which minifier or exactly what Gzip compression level Bundlephobia is using, because at least it’s using the same system everywhere. So I know I’m comparing apples to apples.
Now that said, there are some caveats with Bundlephobia:
- It doesn’t tell you the tree-shaken cost. If you’re only importing one part of a module, the other parts may be tree-shaken out.
- It won’t tell you about subdirectory dependencies. So for instance, I know how expensive it is to
import 'preact', butimport 'preact/compat'could be literally anything –compat.jscould be a huge file, and I’d have no way to know. - If there are polyfills involved (e.g. your bundler injecting a polyfill for Node’s
BufferAPI, or for the JavaScriptObject.assign()API), you won’t necessarily see it here.
In all the above cases, you really just have to run your bundler and check the output. Every bundler is different, and depending on the configuration or other factors, you might end up with a huge bundle or a tiny one. So next, let’s move on to the bundler-specific tools.
Webpack Bundle Analyzer
I love Webpack Bundle Analyzer. It offers a nice visualization of every chunk in your Webpack output, as well as which modules are inside of those chunks.
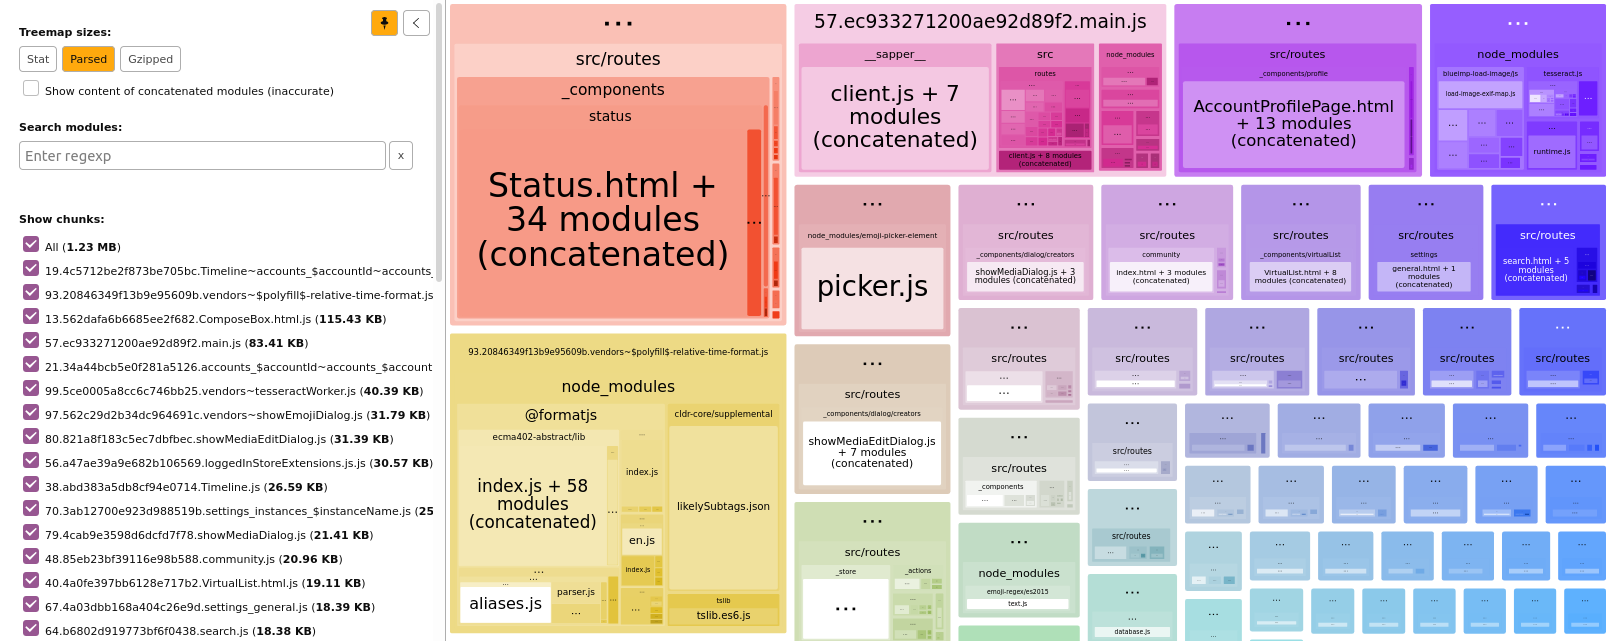
In terms of the sizes it shows, the two most useful ones are “parsed” (the default) and “Gzipped”. “Parsed” essentially means “minified,” so these two measurements are roughly comparable with what Bundlephobia would tell us. But the difference here is that we’re actually running our bundler, so we know that the sizes are accurate for our particular application.
Rollup Plugin Analyzer
For Rollup, I would really love to have a graphical interface like Webpack Bundle Analyzer. But the next best thing I’ve found is Rollup Plugin Analyer, which will output your module sizes to the console while building.
Unfortunately, this tool doesn’t give us the minified or Gzipped size – just the size as seen by Rollup before such optimizations occur. It’s not perfect, but it’s great in a pinch.
Other bundle size tools
Other tools I’ve dabbled with and found useful:
I’m sure you can find other tools to add to this list!
Beyond the bundle
As I mentioned, though, I don’t think JavaScript bundle size is everything. It’s great as a first approximation, because it’s (comparatively) easy to measure, but there are plenty of other metrics that can impact page performance.
Runtime CPU cost
The first and most important one is the runtime cost. This can be broken into a few buckets:
- Parsing
- Compilation
- Execution
These three phases are basically the end-to-end cost of calling require("some-dependency") or import "some-dependency". They may correlate with bundle size, but it’s not a one-to-one mapping.
For a trivial example, here is a (tiny!) JavaScript snippet that consumes a ton of CPU:
const start = Date.now()
while (Date.now() - start < 5000) {}
This snippet would get a great score on Bundlephobia, but unfortunately it will block the main thread for 5 seconds. This is a somewhat absurd example, but in the real world, you can find small libraries that nonetheless hammer the main thread. Traversing through all elements in the DOM, iterating through a large array in LocalStorage, calculating digits of pi… unless you’ve hand-inspected all your dependencies, it’s hard to know what they’re doing in there.
Parsing and compilation are both really hard to measure. It’s easy to fool yourself, because browsers have lots of optimizations around bytecode caching. For instance, browsers might not run the parse/compile step on second page load, or third page load (!), or when the JavaScript is cached in a Service Worker. So you might think a module is cheap to parse/compile, when really the browser has just cached it in advance.

Compilation and execution in Chrome DevTools. Note that Chrome does some parsing and compilation off-main-thread.
The only way to be 100% safe is to completely clear the browser cache and measure first page load. I don’t like to mess around, so typically I will do this in a private/guest browsing window, or in a completely separate browser. You’ll also want to make sure that any browser extensions are disabled (private mode typically does this), since those extensions can impact page load time. You don’t want to get halfway into analyzing a Chrome trace and realize that you’re measuring your password manager!
Another thing I usually do is set Chrome’s CPU throttling to 4x or 6x. I think of 4x as “similar enough to a mobile device,” and 6x as “a super-duper slowed-down machine that makes the traces much easier to read, because everything is bigger.” Use whichever one you want; either will be more representative of real users than your (probably) high-end developer machine.
If I’m concerned about network speed, this is the point where I would turn on network throttling as well. “Fast 3G” is usually a good one that hits the sweet spot between “more like the real world” and “not so slow that I start yelling at my computer.”
So putting it all together, my steps for getting an accurate trace are typically:
- Open a private/guest browsing window.
- Navigate to
about:blankif necessary (you don’t want to measure theunloadevent for your browser home page). - Open the DevTools in Chrome.
- Go to the Performance tab.
- In the settings, turn on CPU throttling and/or network throttling.
- Click the Record button.
- Type the URL and press Enter.
- Stop recording when the page has loaded.

Now you have a performance trace (also known as a “timeline” or “profile”), which will show you the parse/compile/execution times for the JavaScript code in your initial page load. Unfortunately this part can end up being pretty manual, but there are some tricks to make it easier.
Most importantly, use the User Timing API (aka performance marks and measures) to mark parts of your web application with names that are meaningful to you. Focus on parts that you worry will be expensive, such as the initial render of your root application, a blocking XHR call, or bootstrapping your state object.
You can strip out performance.mark/performance.measure calls in production if you’re worried about the (small) overhead of these APIs. I like to turn it on or off based on query string parameters, so that I can easily turn on user timings in production if I want to analyze the production build. Terser’s pure_funcs option can also be used to remove performance.mark and performance.measure calls when you minify. (Heck, you can remove console.logs here too. It’s very handy.)
Another useful tool is mark-loader, which is a Webpack plugin that automatically wraps your modules in mark/measure calls so that you can see each dependency’s runtime cost. Why try to puzzle over a JavaScript call stack, when the tool can tell you exactly which dependencies are consuming exactly how much time?

Loading Three.js, Moment, and React in production mode. Without the User Timings, would you be able to figure out where the time is being spent?
One thing to be aware of when measuring runtime performance is that the costs can vary between minified and unminified code. Unused functions may be stripped out, code will be smaller and more optimized, and libraries may define process.env.NODE_ENV === 'development' blocks that don’t run in production mode.
My general strategy for dealing with this situation is to treat the minified, production build as the source of truth, and to use marks and measures to make it comprehensible. As mentioned, though, performance.mark and performance.measure have their own small overhead, so you may want to toggle them with query string parameters.
Power usage
You don’t have to be an environmentalist to think that minimizing power use is important. We live in a world where people are increasingly browsing the web on devices that aren’t plugged into a power outlet, and the last thing they want is to run out of juice because of a misbehaving website.
I tend to think of power usage as a subset of CPU usage. There are some exceptions to this, like waking up the radio for a network connection, but most of the time, if a website is consuming excessive power, it’s because it’s consuming excessive CPU on the main thread.
So everything I’ve said above about improving JavaScript parse/compile/execute time will also reduce power consumption. But for long-lived web applications especially, the most insidious form of power drain comes after first page load. This might manifest as a user suddenly noticing that their laptop fan is whirring or their phone is growing hot, even though they’re just looking at an (apparently) idle webpage.
Once again, the tool of choice in these situations is the Chrome DevTools Performance tab, using essentially the same steps described above. What you’ll want to look for, though, is repeated CPU usage, usually due to timers or animations. For instance, a poorly-coded custom scrollbar, an IntersectionObserver polyfill, or an animated loading spinner may decide that they need to run code in every requestAnimationFrame or in a setInterval loop.

A poorly-behaved JavaScript widget. Notice the little peaks of JavaScript usage, showing constant CPU usage even while the page is idle.
Note that this kind of power drain can also occur due to unoptimized CSS animations – no JavaScript required! (In that case, it would be purple peaks rather than yellow peaks in the Chrome UI.) For long-running CSS animations, be sure to always prefer GPU-accelerated CSS properties.
Another tool you can use is Chrome’s Performance Monitor tab, which is actually different from the Performance tab. I see this as a sort of heartbeat monitor of how your website is doing perf-wise, without the hassle of manually starting and stopping a trace. If you see constant CPU usage here on an otherwise inert webpage, then you probably have a power usage problem.

The same poorly-behaved JavaScript widget in Performance Monitor. Note the constant low hum of CPU usage, as well as the sawtooth pattern in the memory usage, indicating memory constantly being allocated and de-allocated.
Also: hat tip to the WebKit folks, who added an explicit Energy Impact panel to the Safari Web Inspector. Another good tool to check out!
Memory usage
Memory usage is something that used to be much harder to analyze, but the tooling has improved a lot recently.
I already wrote a post about memory leaks last year, but it’s important to remember that memory usage and memory leaks are two separate problems. A website can have high memory usage without explicitly leaking memory. Whereas another website could start small, but eventually balloon to a huge size due to runaway leaks.
You can read the above blog post for how to analyze memory leaks. But in terms of memory usage, we have a new browser API that helps quite a bit with measuring it: performance.measureUserAgentSpecificMemory (formerly performance.measureMemory, which sadly was much less of a mouthful). There are several advantages of this API:
- It returns a promise that automatically resolves after garbage collection. (No more need for weird hacks to force GC!)
- It measures more than just JavaScript VM size – it also includes DOM memory as well as memory in web workers and iframes.
- In the case of cross-origin iframes, which are process-isolated due to Site Isolation, it will break down the attribution. So you can know exactly how memory-hungry your ads and embeds are!
Here is a sample output from the API:
{
  "breakdown": [
    {
      "attribution": ["https://pinafore.social/"],
      "bytes": 755360,
      "types": ["Window", "JS"]
    },
    {
      "attribution": [],
      "bytes": 804322,
      "types": ["Window", "JS", "Shared"]
    }
  ],
  "bytes": 1559682
}
In this case, bytes is the banner metric you’ll want to use for “how much memory am I using?” The breakdown is optional, and the spec explicitly notes that browsers can decide not to include it.
That said, it can still be finicky to use this API. First off, it’s only available in Chrome 89+. (In slightly older releases, you can set the “enable experimental web platform features” flag and use the old performance.measureMemory API.) More problematic, though, is that due to the potential for abuse, this API has been limited to cross-origin isolated contexts. This effectively means that you have to set some special headers, and if you rely on any cross-origin resources (external CSS, JavaScript, images, etc.), they’ll need to set some special headers too.
If that sounds like too much trouble, though, and if you only plan to use this API for automated testing, then you can run Chrome with the --disable-web-security flag. (At your own risk, of course!) Note, though, that measuring memory currently doesn’t work in headless mode.
Of course, this API also doesn’t give you a great level of granularity. You won’t be able to figure out, for instance, that React takes up X number of bytes, and Lodash takes up Y bytes, etc. A/B testing may be the only effective way to figure that kind of thing out. But this is still much better than the older tooling we had for measuring memory (which is so flawed that it’s really not even worth describing).
Disk usage
Limiting disk usage is most important in web application scenarios, where it’s possible to reach browser quota limits depending on the amount of available storage on the device. Excessive storage usage can come in many forms, such as stuffing too many large images into the ServiceWorker cache, but JavaScript can add up too.
You might think that the disk usage of a JavaScript module is a direct correlate of its bundle size (i.e. the cost of caching it), but there are some cases were this isn’t true. For instance, with my own emoji-picker-element, I make heavy use of IndexedDB to store the emoji data. This means I have to be cognizant of database-related disk usage, such as storing unnecessary data or creating excessive indexes.

The Chrome DevTools has an “Application” tab which shows the total storage usage for a website. This is pretty good as a first approximation, but I’ve found that this screen can be a little bit inconsistent, and also the data has to be gathered manually. Plus, I’m interested in more than just Chrome, since IndexedDB has vastly different implementations across browsers, so the storage size could vary wildly.
The solution I landed on is a small script that launches Playwright, which is a Puppeteer-like tool that has the advantage of being able to launch more browsers than just Chrome. Another neat feature is that it can launch browsers with a fresh storage area, so you can launch a browser, write storage to /tmp, and then measure the IndexedDB usage for each browser.
To give you an example, here is what I get for the current version of emoji-picker-element:
| Browser | IndexedDB directory size |
|---|---|
| Chromium | 2.13 MB |
| Firefox | 1.37 MB |
| WebKit | 2.17 MB |
Of course, you would have to adapt this script if you wanted to measure the storage size of the ServiceWorker cache, LocalStorage, etc.
Another option, which might work better in a production environment, would be the StorageManager.estimate() API. However, this is designed more for figuring out if you’re approaching quota limits rather than performance analysis, so I’m not sure how accurate it would be as a disk usage metric. As MDN notes: “The returned values are not exact; between compression, deduplication, and obfuscation for security reasons, they will be imprecise.”
Conclusion
Performance is a multi-faceted thing. It would be great if we could reduce it down to a single metric such as bundle size, but if you really want to cover all the bases, there are a lot of different angles to consider.
Sometimes this can feel overwhelming, which is why I think initiatives like the Core Web Vitals, or a general focus on bundle size, aren’t such a bad thing. If you tell people they need to optimize a dozen different metrics, they may just decide not to optimize any of them.
That said, for JavaScript dependencies in particular, I would love if it were easier to see all of these metrics at a glance. Imagine if Bundlephobia had a “Nutrition Facts”-type view, with bundle size as the headline metric (sort of like calories!), and all the other metrics listed below. It wouldn’t have to be precise: the numbers might depend on the browser, the size of the DOM, how the API is used, etc. But you could imagine some basic stats around initial CPU execution time, memory usage, and disk usage that wouldn’t be impossible to measure in an automated way.
If such a thing existed, it would be a lot easier to make informed decisions about which JavaScript dependencies to use, whether to lazy-load them, etc. But in the meantime, there are lots of different ways of gathering this data, and I hope this blog post has at least encouraged you to look a little bit beyond the streetlight.
Thanks to Thomas Steiner and Jake Archibald for feedback on a draft of this blog post.


Posted by JavaScript performance beyond bundle size – Full-Stack Feed on February 23, 2021 at 9:31 AM
[…] There’s an old story about a drunk trying to find his keys in the streetlight. Why? Well, because that’s where it’s the brightest. It’s a funny story, but also relatable, be… Read more […]
Posted by Tomáš's webnest: on February 24, 2021 at 2:08 AM
[…] Liked https://nolanlawson.com/2021/02/23/javascript-performance-beyond-bundle-size/ […]
Posted by Kiran K on February 26, 2021 at 9:57 AM
An awesome article. Thanks a lot.
Posted by JavaScript performance beyond bundle size – Bram.us on February 26, 2021 at 4:04 PM
[…] JavaScript performance beyond bundle size → […]
Posted by Nolan Lawson: “JavaScript performance beyond bundle size” - Nicolas Hoizey on March 8, 2021 at 7:04 AM
[…] https://nolanlawson.com/2021/02/23/javascript-performance-beyond-bundle-size/ […]
Posted by Why it’s okay for web components to use frameworks | Read the Tea Leaves on August 1, 2021 at 10:55 AM
[…] « JavaScript performance beyond bundle size […]
Posted by JavaScript News and Updates of March 2021 on January 19, 2022 at 9:04 AM
[…] on performance rates such as parsing time, execution time, memory usage, etc. This insightful article explores this topic in great […]
Posted by React Server Components: the Good, the Bad, and the Ugly on January 19, 2024 at 5:01 AM
[…] at a baseline of around ~70KB, Nuxt at ~60KB, SvelteKit at ~30KB, and Fresh at ~10KB. Of course, bundle cost isn’t everything, and some frameworks have a higher per-component cost that might reach an “inflection point” on […]