AIOps Observability: Going Beyond Traditional APM

AIOps is an emerging technology that applies machine learning and analytics techniques to IT operations. AIOps enables IT teams to leverage advanced algorithms to identify performance issues, predict outages, and optimize system performance. Nodesource sees significant advantages for developers and teams to increase software quality by leveraging AIOPS. We have extended our platform’s (N|Solid) observability capabilities to include AIOps, enabling developers to leverage advanced machine learning and analytics techniques to optimize their Node.js applications.
Our N|Solid platform provides the most advanced visibility into Node.js applications, enabling developers to quickly identify performance issues, detect security vulnerabilities, and troubleshoot errors. N|Solid achieves this level of observability through real-time performance monitoring, comprehensive metrics, and detailed instrumentation of Node.js applications.
Last year, we integrated OpenTelemetry into our runtime and were nearing the release of an extension of this layer into our console. This advancement will further extend our platform to support AIOps. Santiago Gimeno, a Senior Architect, sums up our vision of the integration with OTel (Open Telemetry) and N|Solid:
“In today's world, where applications are becoming more complex and distributed, having a good observability solution is more important than ever. The emergence of OpenTelemetry as the de-facto standard for observability is key. It allows application developers to select solutions that adapt better to their needs. Even more, it allows for healthy competition between observability solution vendors. We support this approach and continue to take steps to ensure N|Solid stays compliant with the OpenTelemetry specification, so everyone can use what we believe is the best observability solution for Node.js.”
Key differences between an APM and Observability
APM (Application Performance Management) and observability are both methods of monitoring and managing the performance and health of software applications, but there are key differences between the two:
Scope: APM is focused on monitoring the performance of applications, while observability is a more comprehensive approach that includes monitoring the infrastructure and application stack, as well as the performance of individual services.
Metrics: APM typically relies on predefined metrics and thresholds to identify performance issues, while observability takes a more flexible approach to collect a wide range of data, including logs, metrics, and traces.
Root cause analysis: APM is designed to quickly identify the root cause of performance issues, often through alerting and automated remediation, while observability takes a more holistic approach that emphasizes the need to understand the relationships between different parts of the system to identify and fix issues.
Proactivity: APM is often reactive, focusing on identifying and fixing issues as they arise, while observability is more proactive, focusing on continuous monitoring and analysis to identify potential issues before they become critical.
Tooling: APM is often built around specific tools and technologies designed to monitor and analyze application performance, while observability is more flexible and adaptable, focusing on integrating a wide range of tools and technologies to provide a comprehensive system view.
You need to have both; they are important to monitoring and managing the performance and health of software applications.
This is why N|Solid is not only an APM but also has observability within its functionalities. And now, with the implementation of ML and SBOM, it goes beyond APM and supports the growing discipline of AIOps.
AIOps: Fundamental concept in Modern IT Operations
AIOps (Artificial Intelligence for IT operations) is an approach to IT operations that leverages machine learning and artificial intelligence to automate and optimize IT tasks. AIOps aims to enhance the efficiency and effectiveness of IT operations by leveraging the vast amount of data generated by various IT systems and applications.
Observability refers to IT teams' ability to observe and understand the behavior of complex systems in real-time, using a combination of monitoring, logging, and analytics tools.
AIOps and observability enable IT teams to proactively monitor and manage IT systems, applications, and infrastructure, allowing them to identify and resolve issues quickly. AIops uses machine learning and AI algorithms to identify patterns in large amounts of data, while observability provides the visibility and context needed to understand the behavior of complex systems.
Modern Observability in Place
Support for open-source tracing tools and standards like OpenTelemetry facilitates team collaboration in resolving issues. Open Telemetry is the second most active CNCF project, behind only Kubernetes, showcasing its importance to the industry.
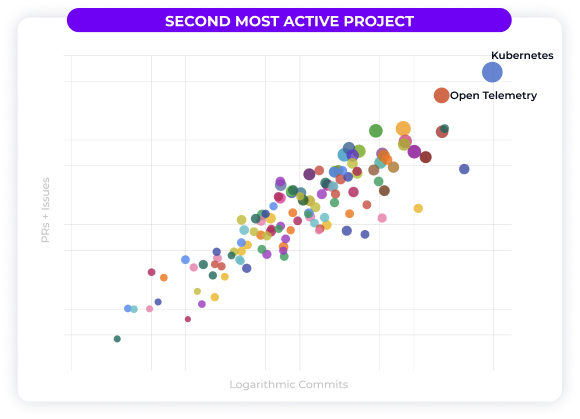
Image Twitter Michael Haberman @hab_mic
Following this standard, N|Solid (since N|Solid 4.8.0) supports OTEL:
- Implements the OpenTelemetry TraceAPI, allowing users to use the de-facto standard API to instrument their code.
- It supports using many instrumentation modules available in the Open Telemetry ecosystem. It supports exporting traces using the Open Telemetry Protocol(OTLP) over HTTP.
- With this feature is now possible to send N|Solid runtime monitoring information (metrics and traces) to backends supporting the Open Telemetry standard like multiple APMS (Dynatrace, Datadog, Newrelic, etc.).
Additionally, we included OTEL in the ‘APM performance dashboard,’ an open-source tool we released to the community, enabling developers and organizations to understand the impact of APM tools' performance.
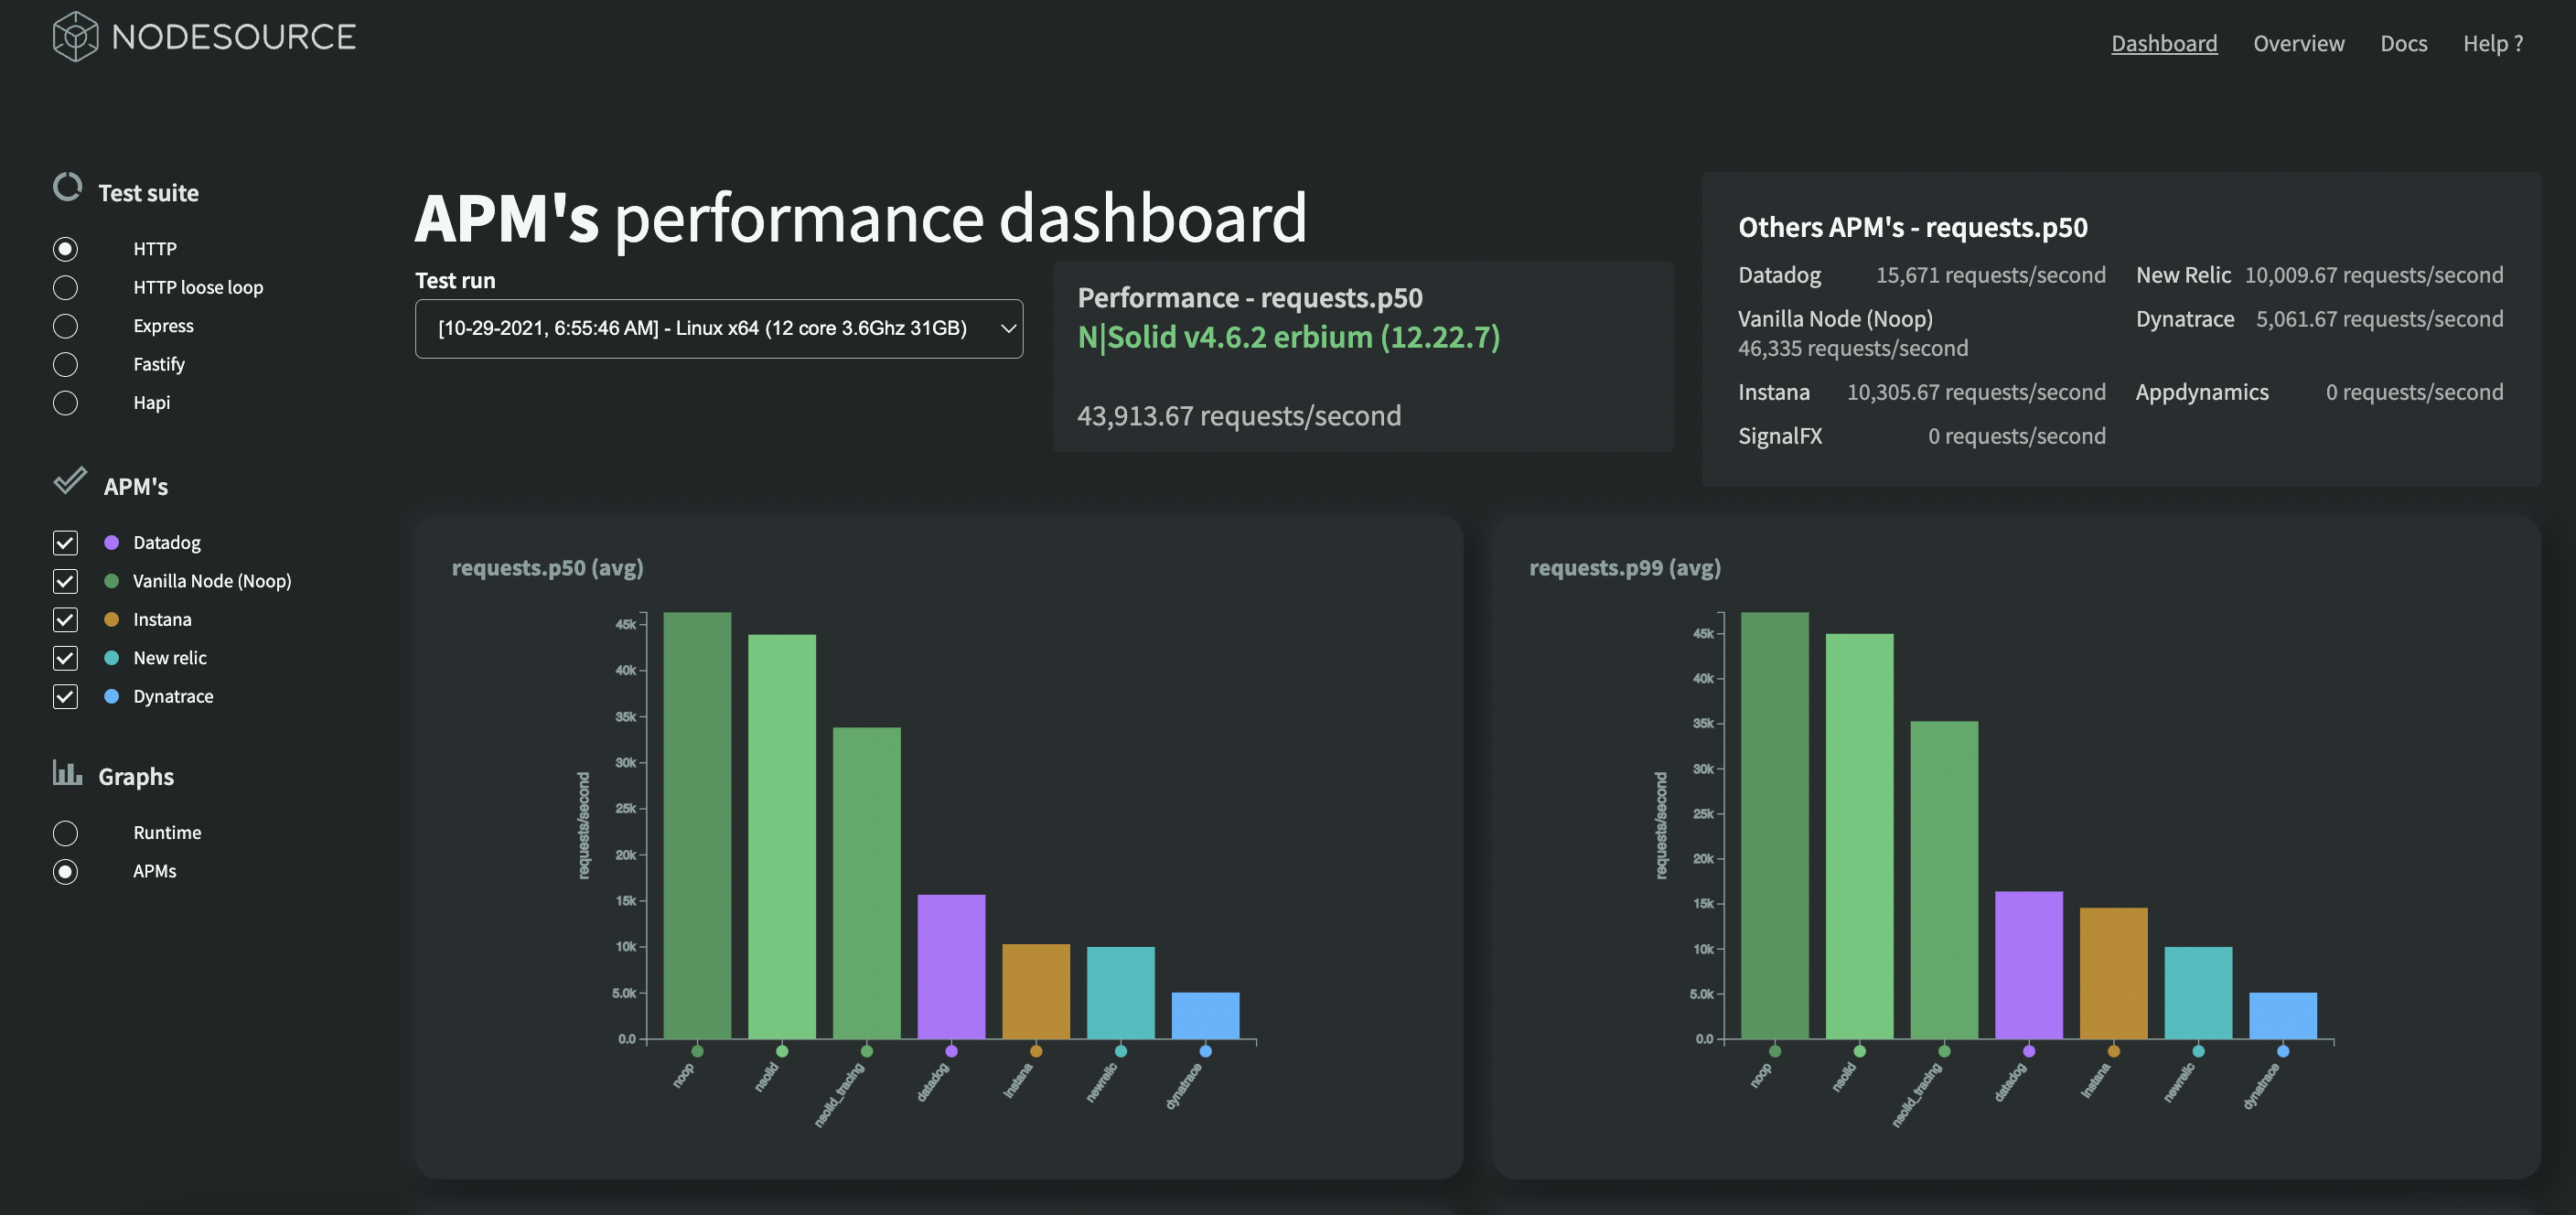
Img APM’s Performance Dashboard View
Recent enhancements to the tool include the following:
- Updated the data with N|Solid 4.8.0 -> 16.16.0 and 14.20.0
- Added a few new tests: especially with different solutions for graphql.
- Added more APMs: opentelemetry, AppDynamics
- Added testing of N|Solid against Datadog, Dynatrace, and NewRelic.
Do you want to implement OTel in your Node.js application? 👇
Enriching telemetry data with metadata is an important aspect of observability, and OpenTelemetry provides a flexible and extensible framework for doing so. However, there can be challenges in implementing this in practice, especially when dealing with multiple tools and technologies.
One approach to addressing this challenge is to use a centralized configuration management tool to ensure consistency in metadata enrichment across your observability stack. Please review the following articles to give you an accurate guide to implementing Opentelemetry in your project.
Enhance Observability with Opentelemetry tracing - Part 1
Instrument your Nodejs Applications with Open Source Tools - Part 2
However, if you want this implementation out of the box and have other useful features, we invite you to try N|Solid.
Conclusion
N|Solid Supports OpenTelemetry Features, Integrates SBOM and ML at its Core.
By supporting OpenTelemetry features, N|Solid provides seamless integration with this framework, enabling customers to understand their applications, infrastructure behavior, and performance. This integration enhances the ability of developers and operators to troubleshoot issues, identify bottlenecks, and optimize application performance.
N|Solid's integration of Software Bill of Materials (SBOM) provides a comprehensive list of all software components used in an application, including open-source libraries and dependencies, which helps organizations to mitigate security risks and ensure compliance with regulations. By integrating SBOM at its core, N|Solid provides organizations with an efficient and reliable way to manage the security and compliance of their software applications.
Finally, N|Solid's integration of machine learning (ML) at its core is another critical feature that helps to identify patterns and anomalies in data, allowing developers and operators to gain insights that are not easily detectable using traditional monitoring tools. This integration of ML at the core of N|Solid enables organizations to improve the overall reliability, performance, and security of their applications and services.
N|Solid's support of OpenTelemetry features, integration of SBOM, and integration of ML at its core provides developers and operators with a comprehensive set of tools to manage and optimize their applications and infrastructure, making N|Solid a valuable platform in the modern software development and operations landscape.
Ready to connect?
If you want to know more about our APM’S Benchmark project and get the most out of your Node.js application, read this incredible article by our VP of engineering, Adrián Estrada, 'In-depth analysis of the APMs performance cost in Node.js.'
We also invite you to 🛠️ Use the ✨APM's Performance Dashboard✨here:
📗 Read the full blog post here: https://nsrc.io/4xFaster
💚 Contribute here: https://github.com/nodesource/node-APMs-benchmark
If you have any questions, please contact us at info@nodesource.com or through this form.
To get the best out of Node.js and experience the benefits of its integrated features, including OpenTelemetry support, SBOM integration, and machine learning capabilities. Sign up for a free trial and see how N|Solid can help you achieve your development and operations goals. #KnowyourNode