
Dynatrace enables you to understand monitored applications end-to-end, across all microservices, from each request down to the code level. Dynatrace AI enables you to immediately understand the impact of changes, like new software deployments, and in the case of discovered issues, narrows the root cause down to the individual service, request, or deployment that triggered the problem. This is not only helpful for traditional operations teams, it’s also helpful to DevOps teams that deal with large numbers of applications and microservices.
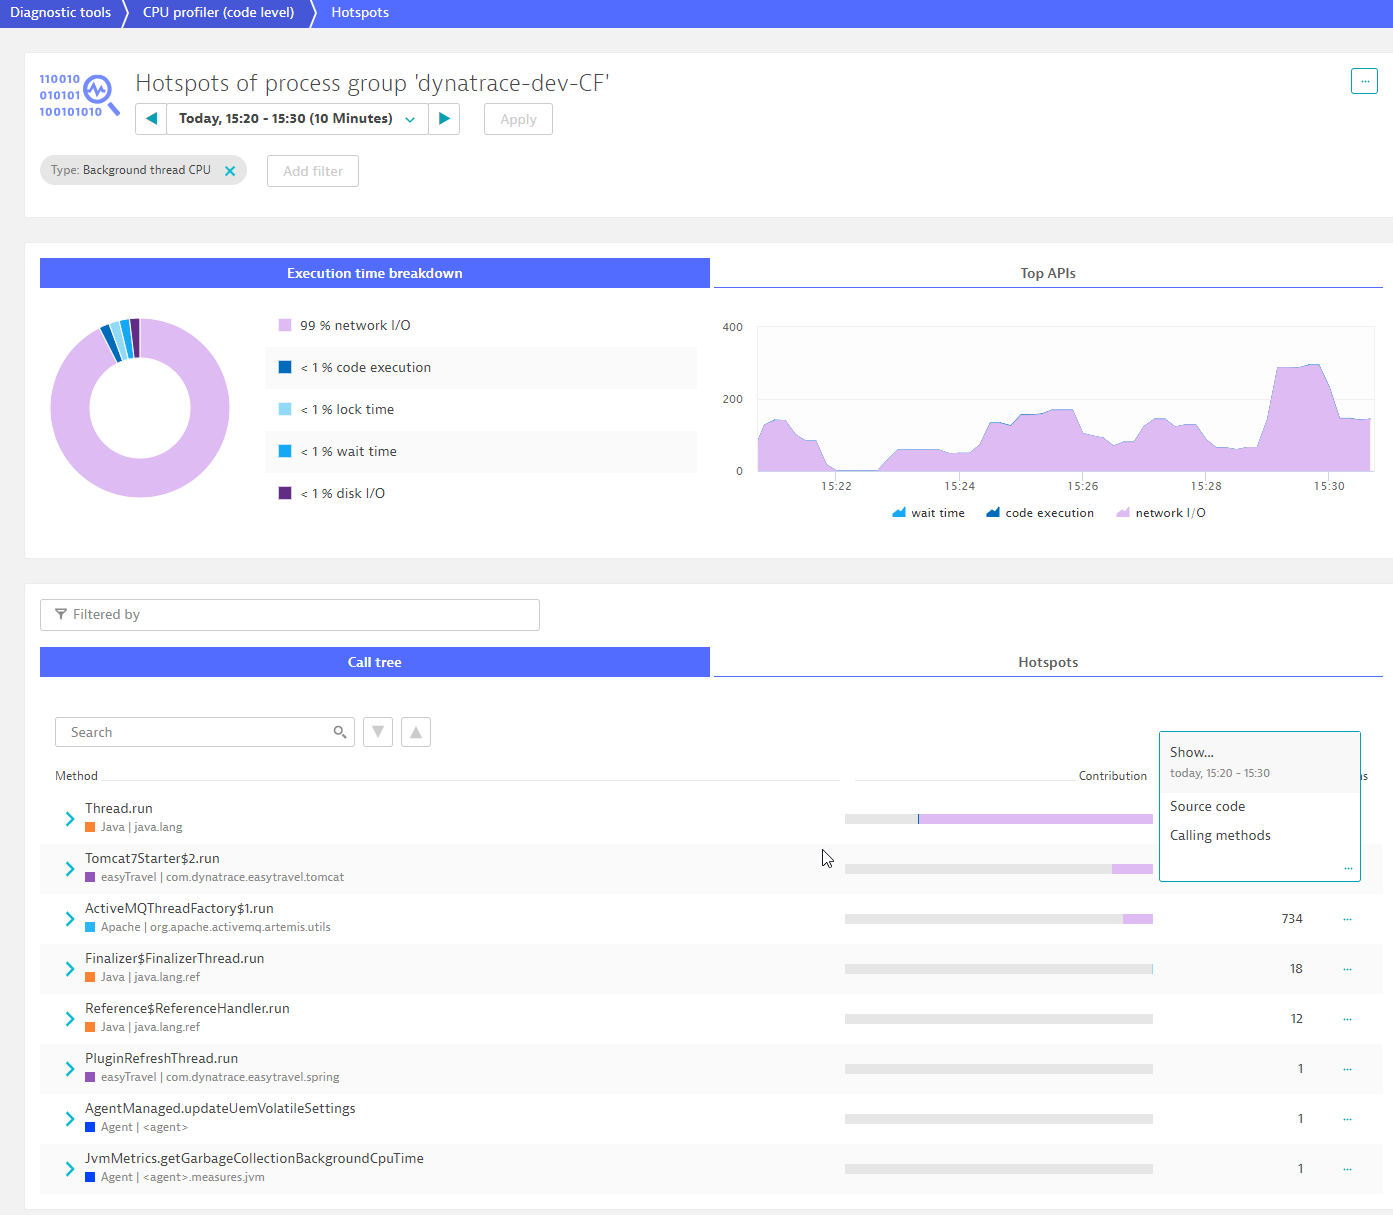
At the same time, features like response time hotspot analysis and code-level method hotspot analysis are geared toward developers. These features enable developers to understand the real world performance of their code.
Modern applications are often released at a fast pace, with daily deployments. This can make it a challenge to know which version of one’s code is actually being executed. In some cases, problematic code may belong to a third-party component. In such cases, it’s helpful to be able to better understand the deployed code of these third-party components.
Dynatrace can now help you understand which code is actually deployed in a given monitored system for any Java, .NET, or Node.js application.
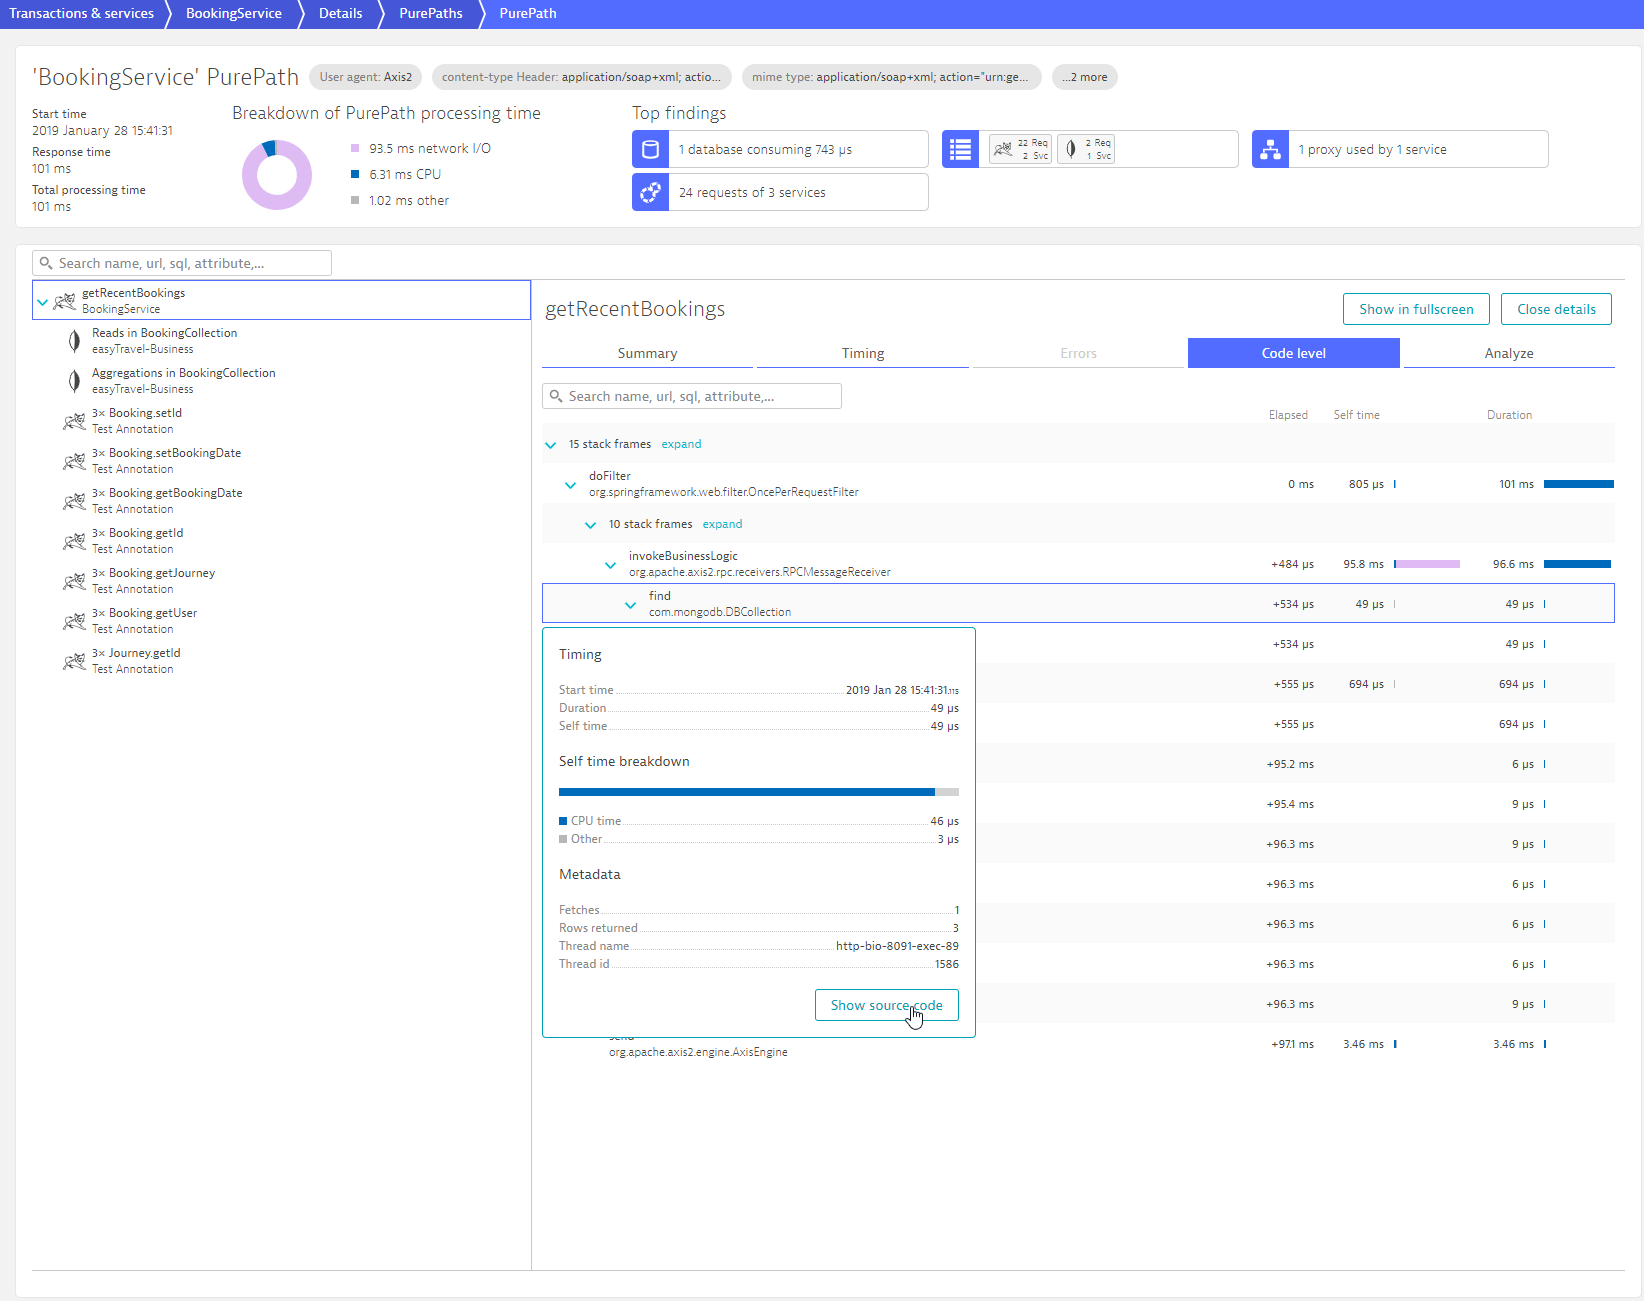
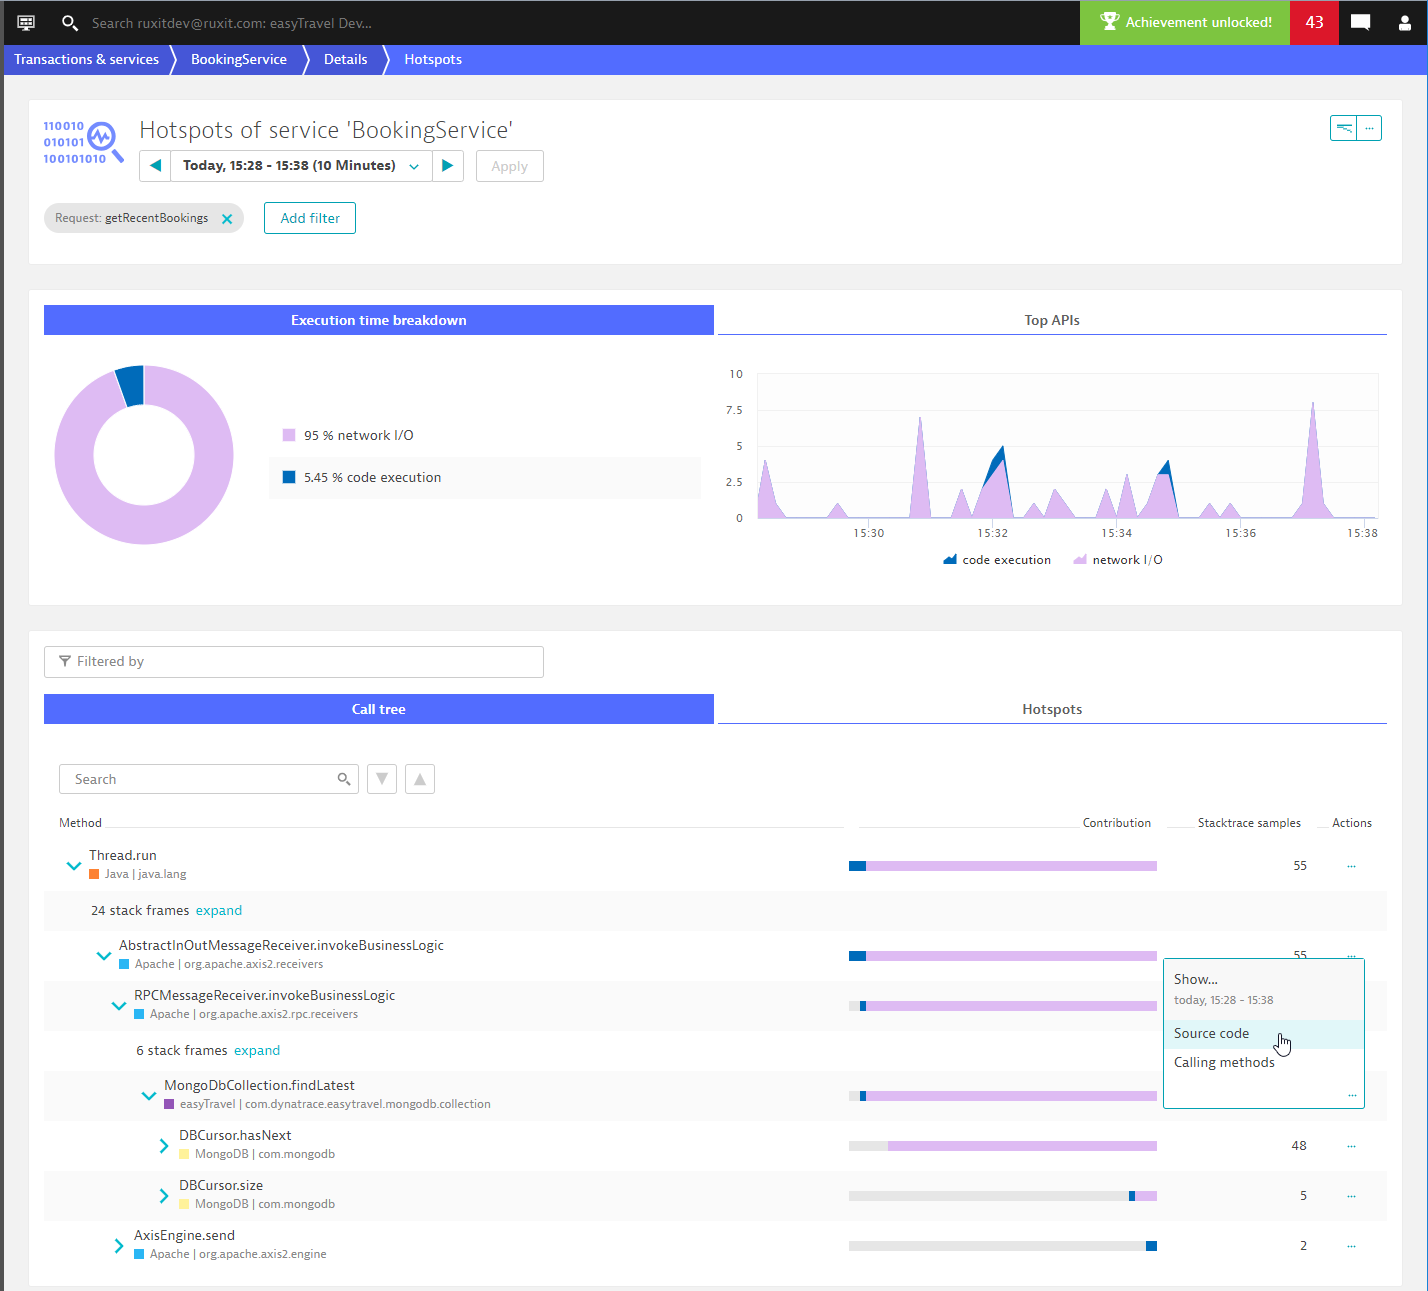
To do this, you first need to look at the code that you want to understand. Possible entry points are the CPU profiler in Diagnostic tools, method hotspot analysis of a specific service or request, or a PurePath.
In the case of Java, you can view the class hierarchy and decide which class you want to download. For security reasons, a download requires the confidential data viewer permission for the respective process or service.
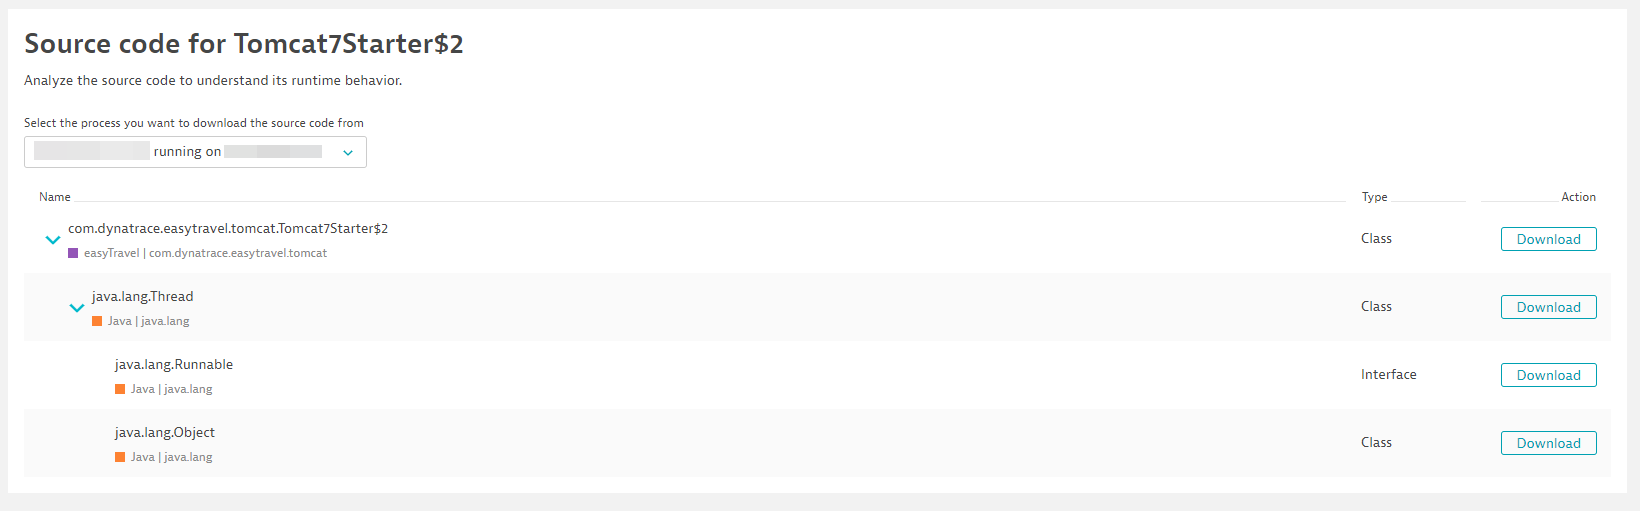
Dynatrace doesn’t decompile Java or .NET code itself. The reason for this is that there are many different decompilers, some of which work better with newer Java code and others that work better with older code. No single compiler deals equally well with all versions of Java code. For Java, we recommend using Bytecode Viewer, which embeds multiple Java decompilers and allows you to choose the best in each case. It’s open source and free to use. Simply drag the downloaded class file into the viewer to see the result.
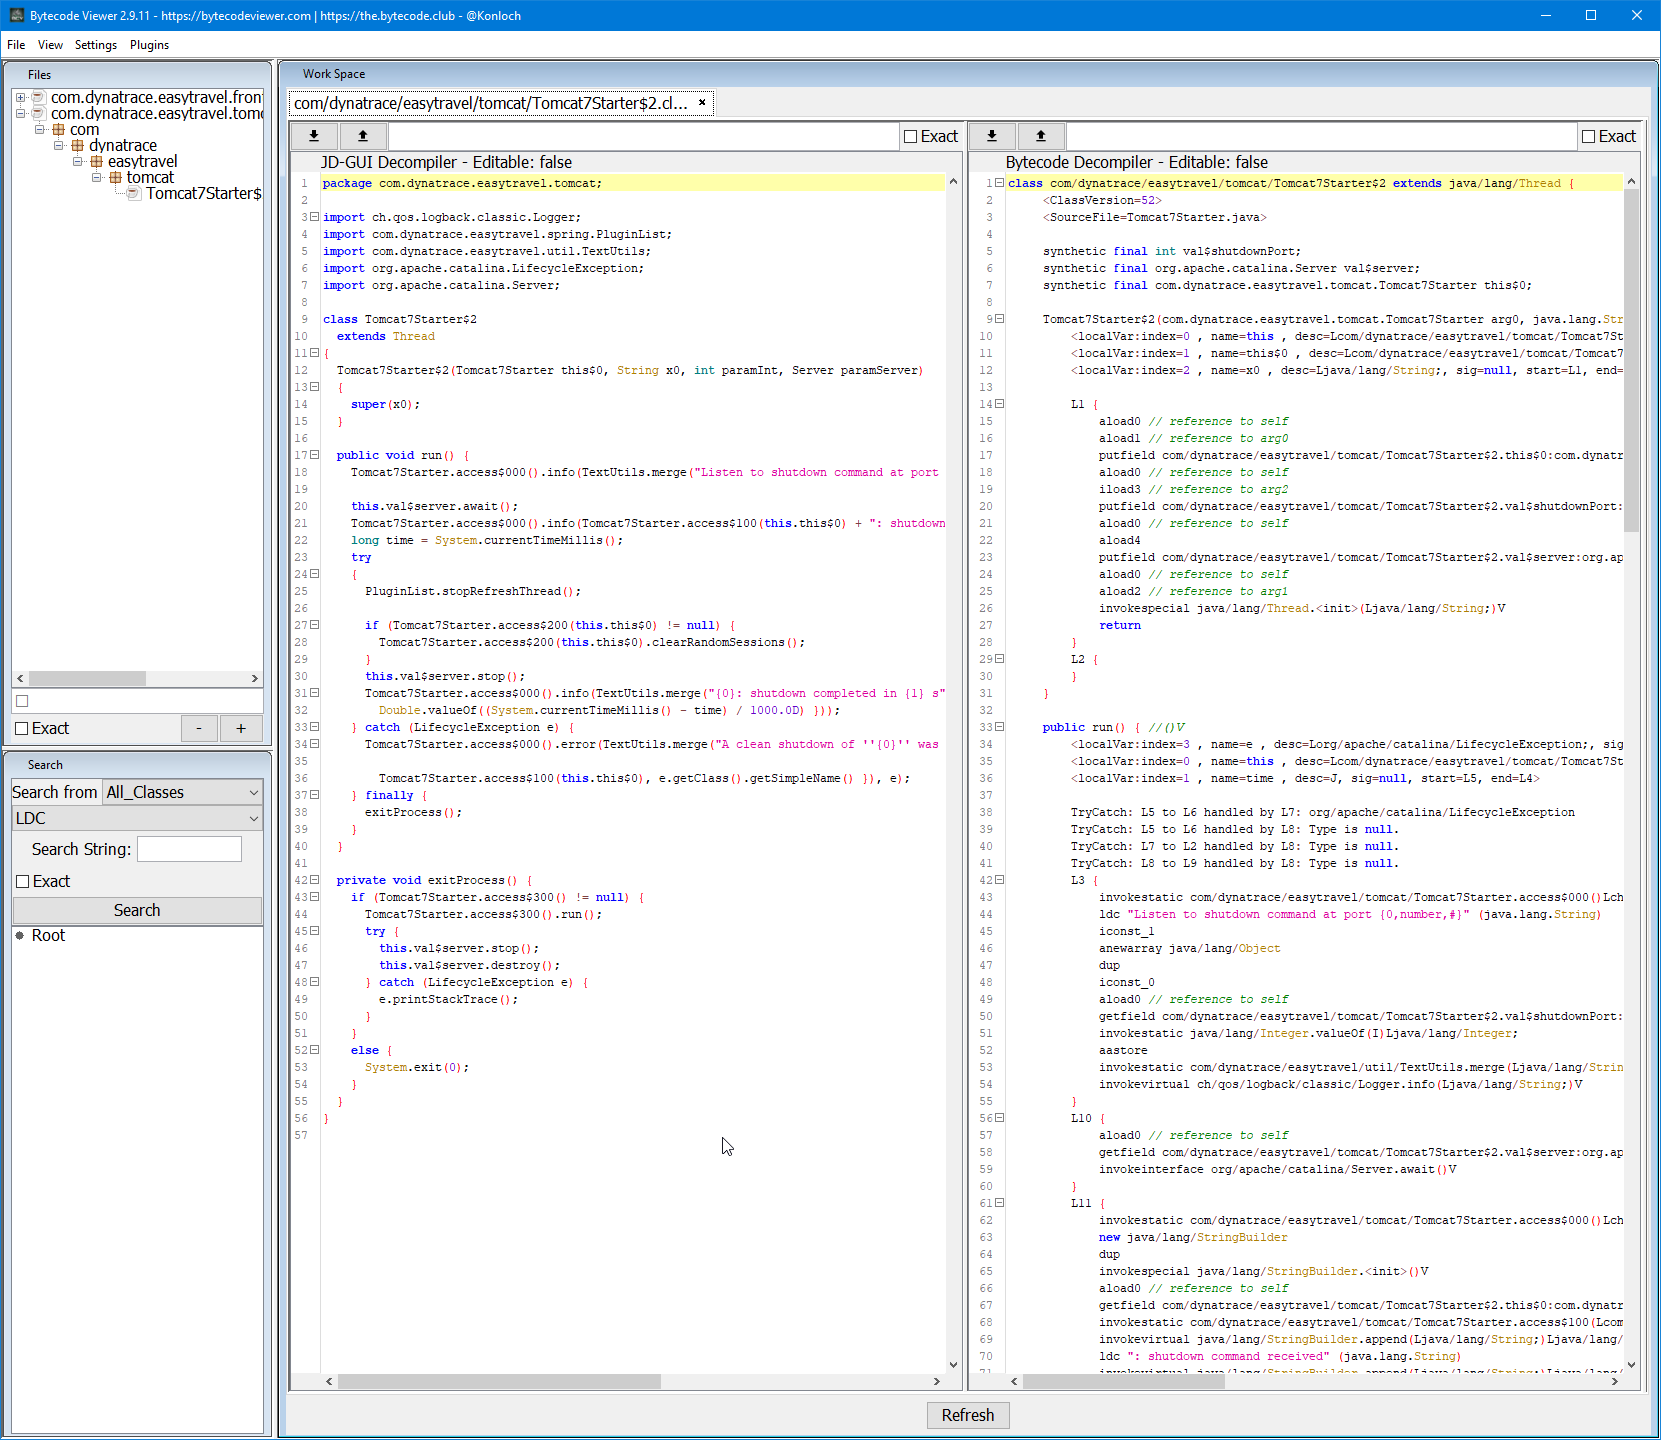
With this ability to download code, you can be absolutely certain of the code that is executed in your service.
This feature also works for .NET, with the difference that it downloads the complete .NET assembly, and you need to use a .NET decompiler like dotPeak or ILSpy.
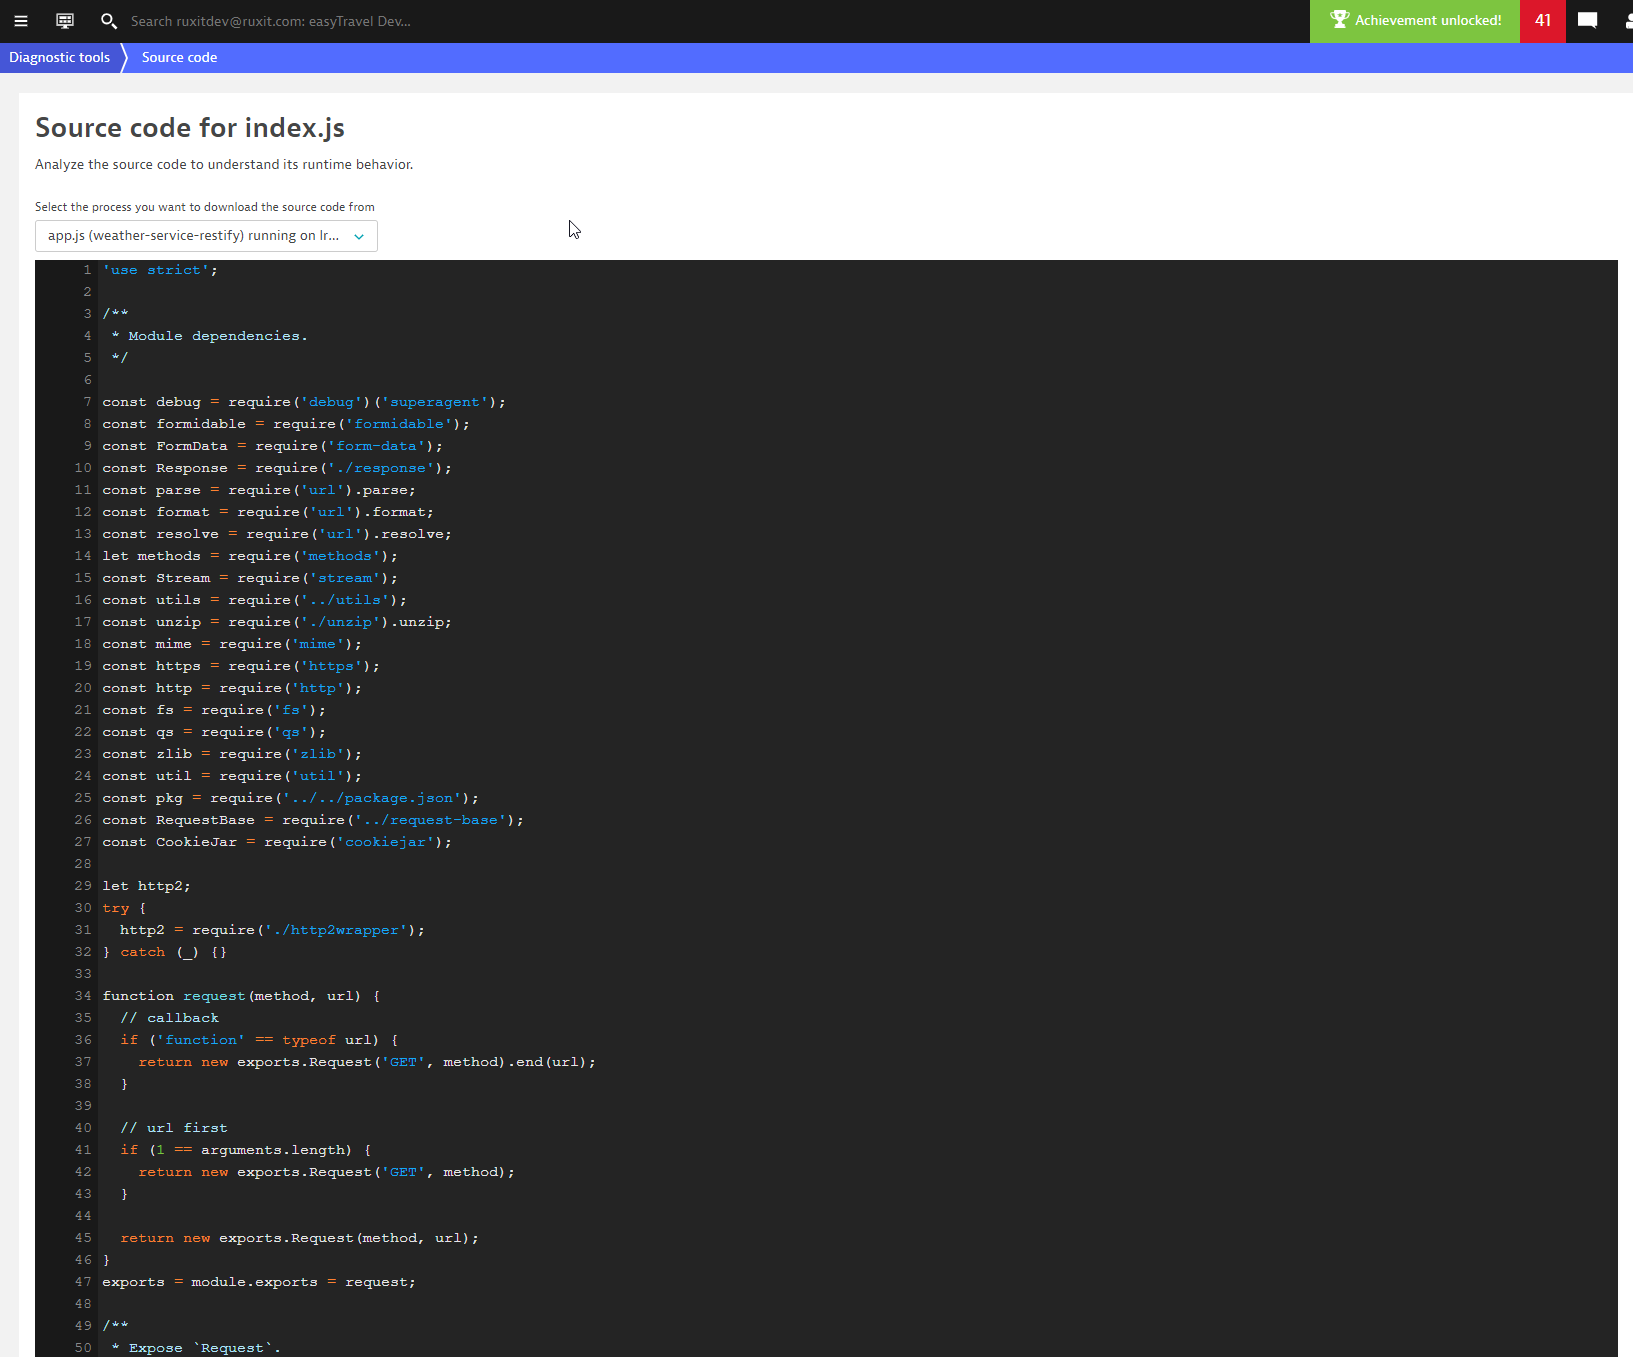
For Node.js, Dynatrace displays the source code directly, as it’s not compiled in the first place.
This feature is available for Dynatrace SaaS and for Dynatrace Managed version 1.162. It requires an up-to-date version of OneAgent.


Looking for answers?
Start a new discussion or ask for help in our Q&A forum.
Go to forum