Understanding problems in web apps is hard. Between mysterious JavaScript errors, user-reported bugs, and issues caught in QA, there’s a constant struggle to get ahead of the problems affecting your users. And these are just the obvious issues — most bugs are never actually reported since users who have a bad experience just leave or suffer in silence.
To solve this problem, developers are increasingly adopting front-end logging tools, since modern state management libraries like Redux leave a rich audit trail. Logging actions and state in production makes it easy to understand bugs and user-reported issues.
In this post, I’ll show you how to set up Redux logging with LogRocket. Then, I’ll discuss techniques for making Redux apps easier to debug.
This post was originally published on logrocket.com and reposted here with the author’s permission. If you enjoy reading, why not check out some of Ben’s other articles? If you’d like to learn more about Redux, why not sign up for SitePoint Premium and enroll for our latest course: Forms with React and Redux?
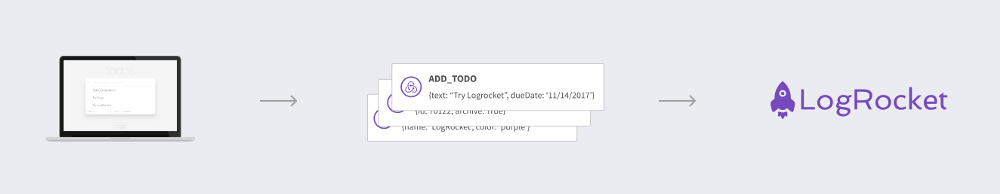
LogRocket: A DVR for Web Apps
LogRocket is a new type of developer tool. It’s like a DVR for web apps, recording literally everything that happens on your site. It works perfectly with any app, regardless of framework, and has plugins to log additional context from React, Redux, Vue.js, and Angular. With LogRocket, instead of guessing why problems happen, you can replay sessions with bugs or user issues to quickly understand the root cause.
In addition to logging Redux actions and state, LogRocket records console logs, JavaScript errors, stacktraces, network requests/responses with headers + bodies, browser metadata, and custom logs. It also instruments the DOM to record the HTML and CSS on the page, recreating pixel-perfect videos of even the most complex single page apps.
Setting up LogRocket
Setting up LogRocket is easy, and only requires adding a few lines of code to your app:
- Install with npm:
npm i --save logrocket. - Create a free account at https://app.logrocket.com, and take note of your application id.
- Initialize LogRocket in your app:
import LogRocket from 'logrocket'; // Initialize LogRocket with your app ID LogRocket.init(<your_application_id>); - Add the Redux middleware.
import { applyMiddleware, createStore } from 'redux';
const store = createStore(
  reducer, // your app reducer
  applyMiddleware(middlewares, LogRocket.reduxMiddleware()),
);
That’s it for the basic setup- this is all you need to get started with LogRocket!
LogRocket also has plugins for alternate Flux implementations like ngrx and vuex, which you can read about here.
Replaying User Sessions
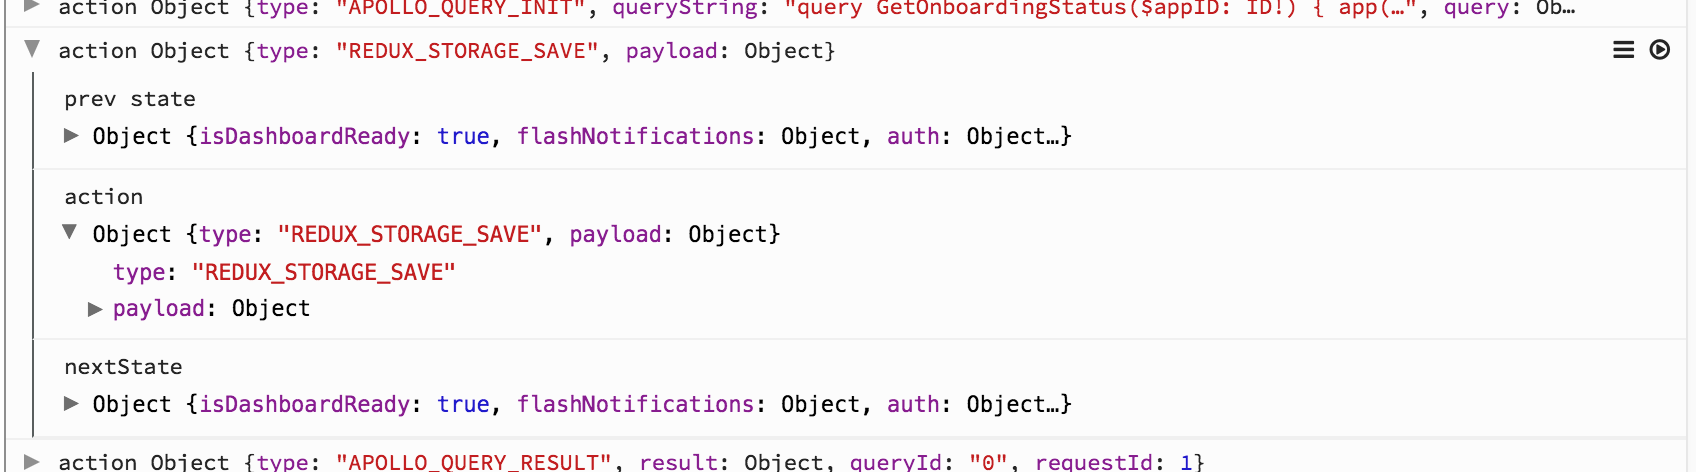
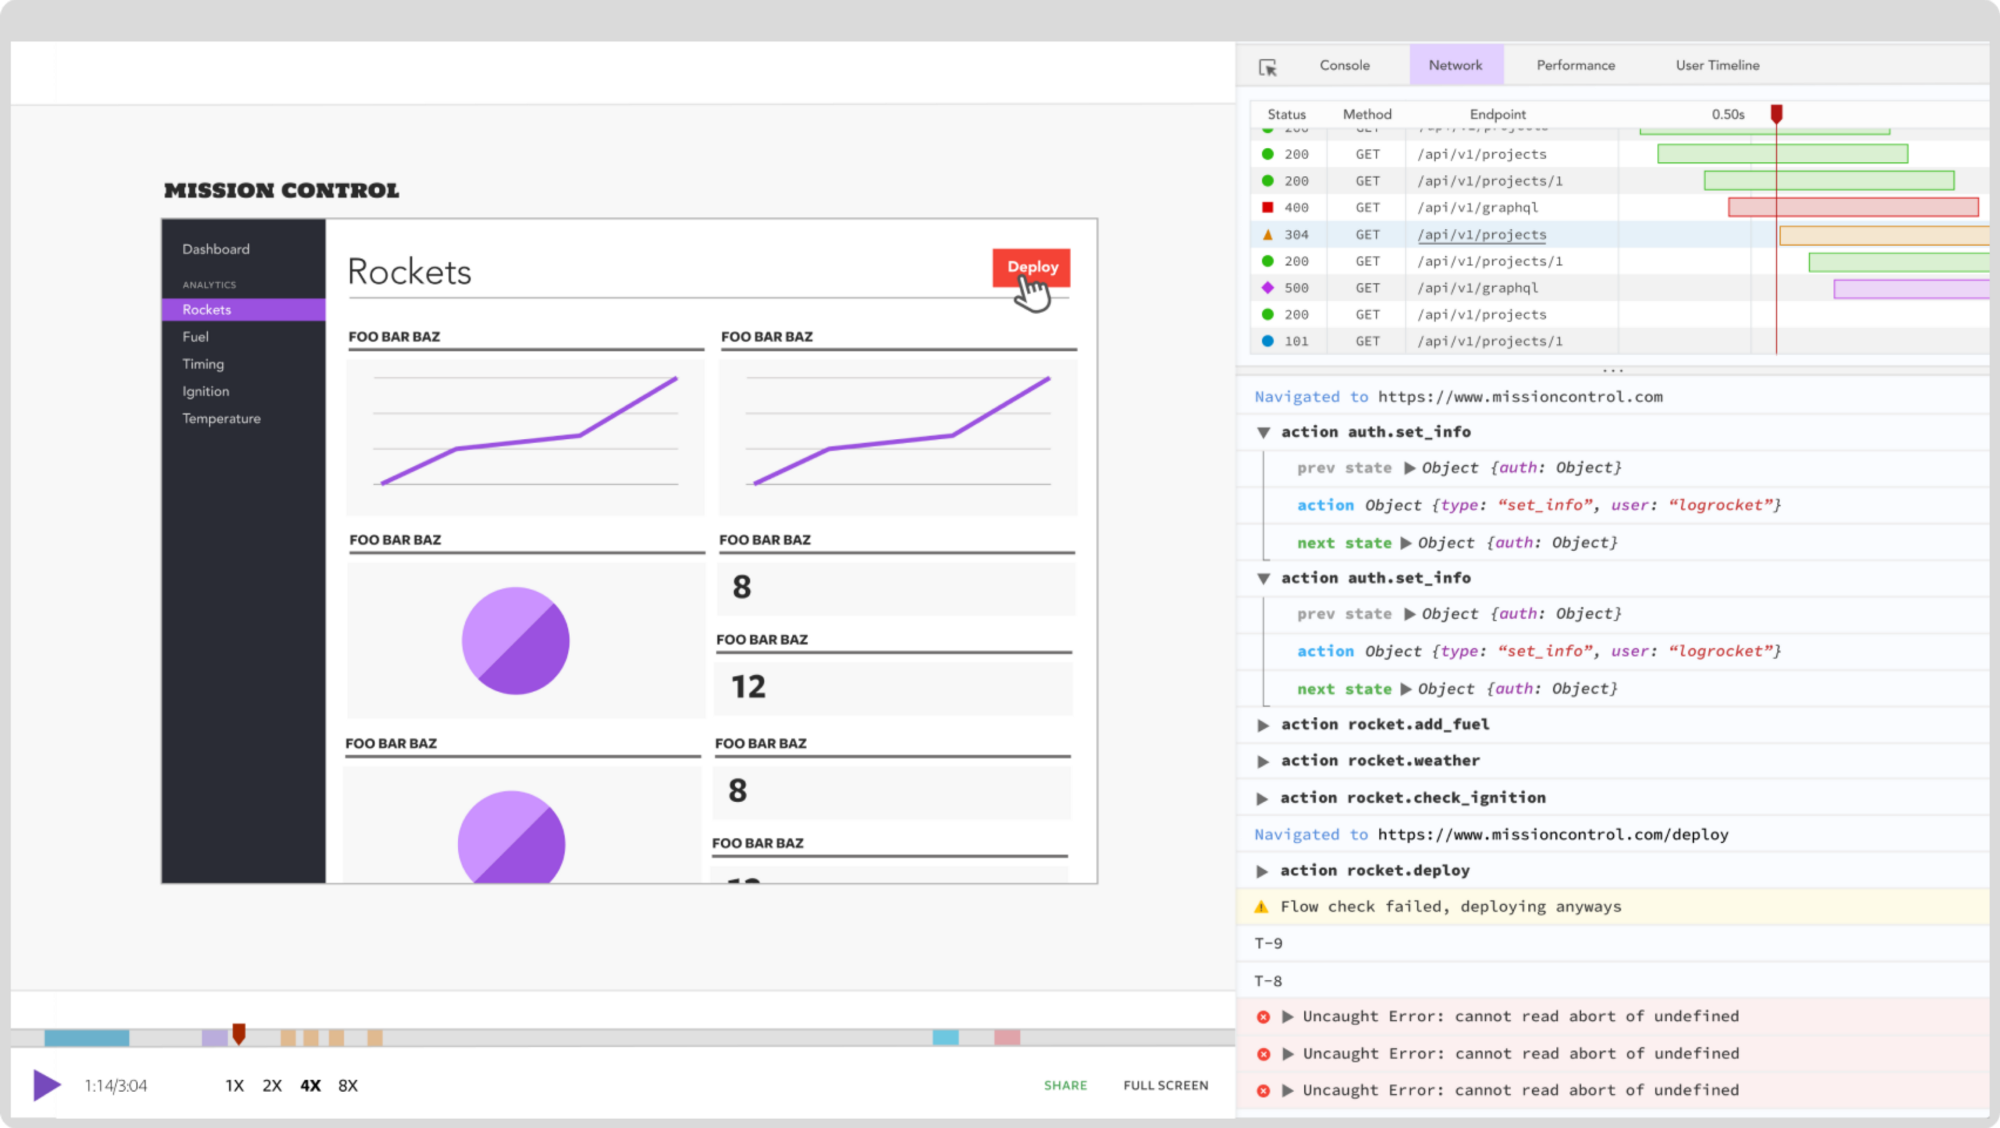
Replaying a session in LogRocket is like seeing it happen in your own browser. You can inspect Redux actions with the full action payload as well as the previous and next states.
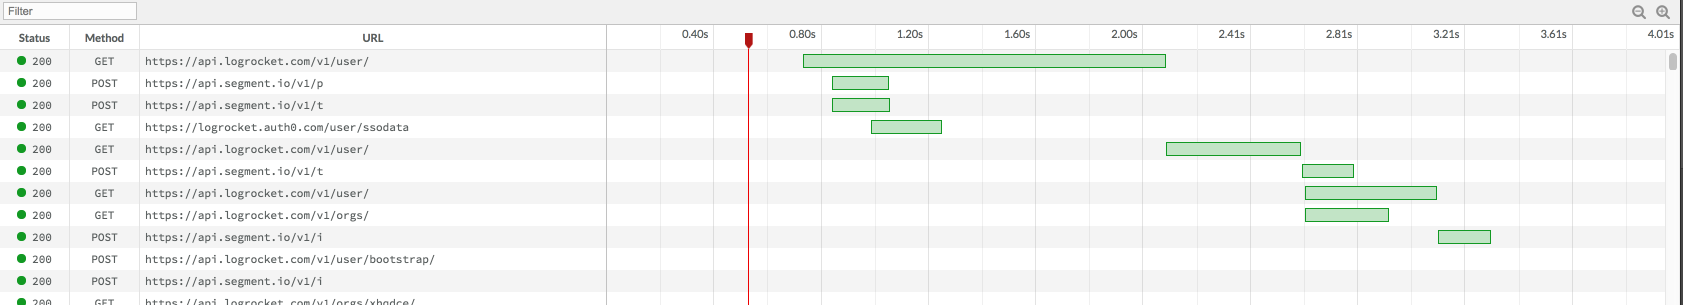
LogRocket captures both network requests and responses and lets you dig in to specific requests and see the headers and body. The waterfall chart shows timings, making it easy to see which requests were slow, or if a potential race condition occurred.
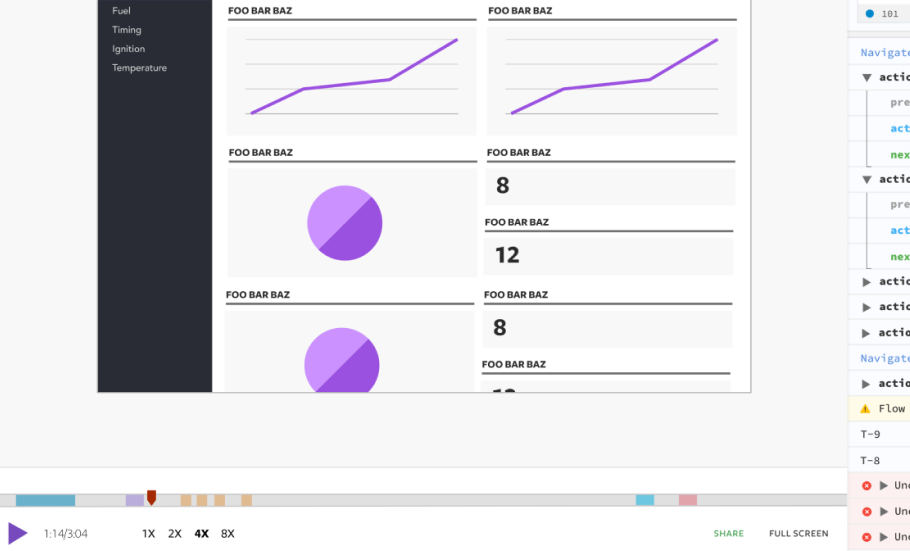
Sometimes Redux logs alone aren’t enough to understand a bug, especially when dealing with user-reported issues. LogRocket’s video replay helps here by letting you see exactly what a user saw in your app.
Since this video is actually a reconstruction of the DOM (and not a real video) you can inspect HTML/CSS to understand visual bugs, or play at 2x speed to gain a quick understanding of what a user did in the app when handling support issues.
Integrating Redux Logging into Your Workflow
Being able to replay user sessions and see Redux logs is helpful across the development workflow.
Fixing Bugs
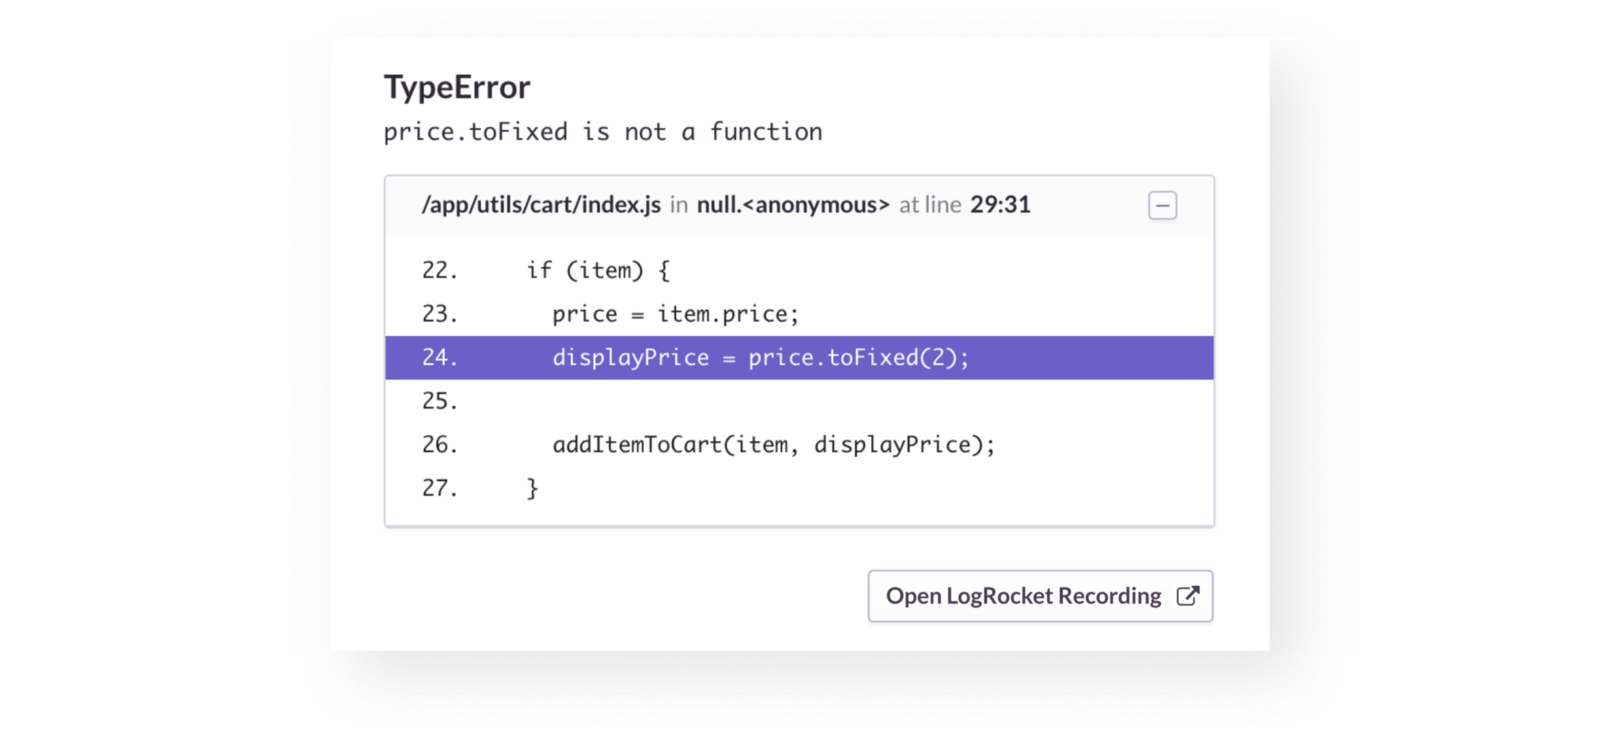
LogRocket integrates with error reporting tools like Sentry and Bugsnag, letting you see Redux logs and video for every bug. This is not only helpful for fixing bugs, but also for understanding error impact, since some JavaScript errors are completely innocuous. By watching the video from when an error occurred, you can easily tell if it actually affects users, or can be ignored.
Support
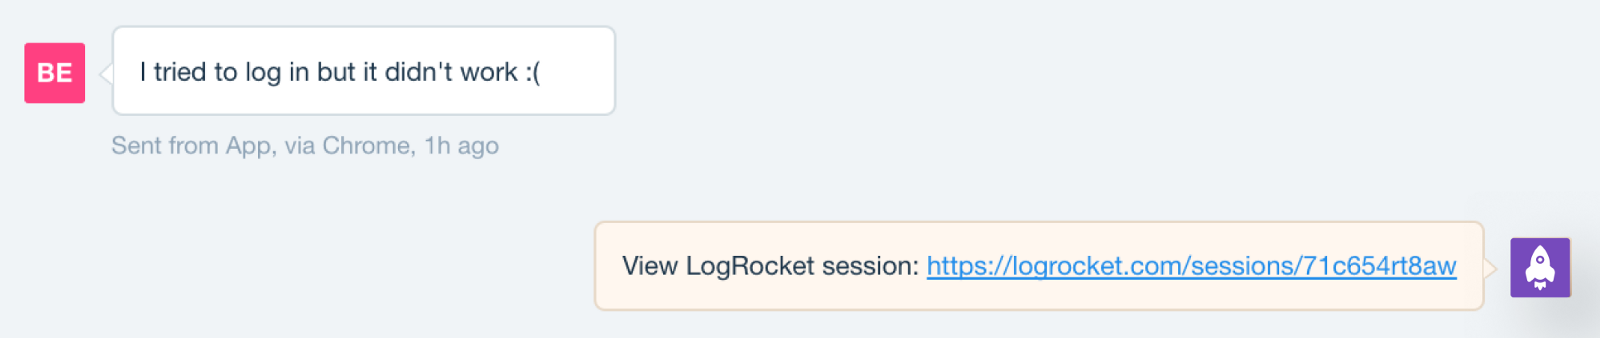
All too often, users will report issues but not give enough context to figure out exactly what happened.
If you are using a chat support tool like Intercom, you can integrate LogRocket directly so that it adds a note with a recording URL whenever a user starts chatting.
If you are integrating with a more general analytics tool, you can add recording URL’s with a tracking API like this:
LogRocket.getSessionURL(function (sessionURL) {
  analytics.track('LogRocket recording', sessionURL);
})
Making the Most of Production Redux Logging
Production logging is immediately useful in all Redux apps, but by architecting your app with logging in mind, you can ensure that logs are maximally useful when debugging issues.
Try to Keep Most State in Redux
I don’t want to get into the debate on local vs Redux state here, but when deciding whether a given piece of state should be in Redux, ask yourself if seeing that state could be helpful when debugging issues. If the answer is yes, consider putting that state in Redux so that it will be logged with crash reports and user issues.
Use Data Fetching Libraries That Leverage Redux
Libraries like apollo-client for GraphQL, and redux-query for REST both facilitate fetching data from the network via Redux. They use Redux as a persistence layer, meaning that when debugging issues, you can inspect your Redux logs to see what data these clients have fetched.
If you’d prefer a simpler approach, you can roll your own data fetching “framework” by simply dispatching explicit actions when querying and receiving data from the network.
Use Redux to Handle Sources of Non-Determinism
When accessing data from APIs like websockets, local storage, IndexedDB, or even Date(), consider dispatching Redux actions with the result, so that you can easily debug these in the future. For example, when listening on a websocket, dispatch a Redux action on every message- that way you can see the data in your
Redux logs.
Leverage Other Console APIs
Console methods like console.time(), console.count() and console.group() let you add rich data to your logs like React component render counts, transaction timings and component lifecycle logs. If
you’re interested in learning more, I wrote a post about this here.
Build and Upload Source Maps to LogRocket
LogRocket supports source maps which you can upload via a cli. By doing this you can see symbolicated stack traces for JavaScript errors, Redux actions, console logs and network requests, which lets you see where particular actions were triggered in your code.
Conclusion
React and Redux are often lauded as tools for building maintainable applications — a significant component of which is debuggability. Logging Redux data in production gives such insight since bugs and other user-reported issues can be easily debugged by inspecting Redux state, network requests and the DOM.
Using LogRocket for Redux logging can greatly simplify fixing bugs and supporting your users. You can get started with LogRocket here.
Frequently Asked Questions (FAQs) about Redux Logging in Production with LogRocket
What is the primary function of LogRocket in Redux logging?
LogRocket is a powerful tool that helps developers track, record, and understand user interactions within their web applications. It provides a comprehensive view of what happens in an application, including network requests, console logs, and even user actions. This makes it easier to identify and fix issues, as developers can see exactly what led to a problem. LogRocket is particularly useful in Redux applications, as it can log Redux actions and state, giving a clear picture of the sequence of events.
How does LogRocket differ from other logging tools?
LogRocket stands out from other logging tools due to its session replay feature. This feature allows developers to replay problematic sessions, seeing exactly what the user saw. This can be invaluable in identifying and fixing bugs. Additionally, LogRocket integrates seamlessly with Redux, making it easy to log Redux actions and state.
How can I integrate LogRocket with my Redux application?
Integrating LogRocket with a Redux application is straightforward. After installing LogRocket via npm, you can initialize it in your application’s entry file. Then, you can use LogRocket’s Redux middleware to log Redux actions and state. This middleware can be added when creating your Redux store.
Can I use LogRocket in a production environment?
Yes, LogRocket is designed to be used in production environments. It has a variety of features that make it suitable for production use, such as privacy controls to protect sensitive user data, and performance optimizations to ensure it doesn’t slow down your application.
What kind of data can LogRocket log?
LogRocket can log a wide range of data, including network requests, console logs, Redux actions and state, and user interactions. This gives a comprehensive view of what happens in an application, making it easier to identify and fix issues.
How does LogRocket handle sensitive user data?
LogRocket has robust privacy controls to protect sensitive user data. You can configure these controls to prevent certain data from being logged. For example, you can prevent form inputs from being logged to protect user passwords.
Can I use LogRocket with other state management libraries?
Yes, while LogRocket integrates seamlessly with Redux, it can also be used with other state management libraries. It provides middleware for several popular libraries, including MobX and Vuex.
How does LogRocket help in debugging?
LogRocket’s session replay feature can be invaluable in debugging. By replaying problematic sessions, developers can see exactly what the user saw, making it easier to identify and fix bugs. Additionally, LogRocket’s comprehensive logging of network requests, console logs, and user interactions can provide valuable context when debugging.
Can I customize what data LogRocket logs?
Yes, LogRocket is highly customizable. You can configure what data is logged, and you can also add custom logs to track specific events or state in your application.
Is LogRocket suitable for large-scale applications?
Yes, LogRocket is designed to handle large-scale applications. It has performance optimizations to ensure it doesn’t slow down your application, and it can handle a large volume of logs. Additionally, LogRocket’s powerful search and filtering features make it easy to find relevant logs in a large dataset.
 Ben Edelstein
Co-Founder @LogRocket. Previously @Google.