
Jenkins is the build server of choice for our engineering teams at Dynatrace. And while we take pride in providing fast and on-demand build feedback to our engineers, it’s not an easy task to keep build times fast with an ever-growing code base, new dependencies and constantly changing tech stacks.
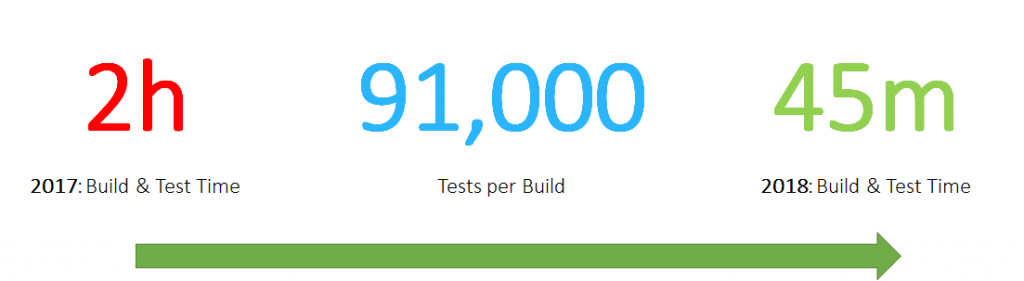
Our One Engineering Productivity Team approached me two weeks ago via our internal Slack channel. They thought it was about time to share some of their learnings on how they configure, deploy, monitor and optimize our Jenkins environment to ensure fast build times. Their goal for this year is to provide full build and test execution of OneAgent across all platforms within 45 minutes. Now keep in mind that our OneAgent supports several platforms (Linux, Windows, Solaris, AIX …), container technologies and tech stacks. For a full list check out our technical support matrix.
To achieve this goal, they leverage Jenkins Nodes & Executors that are automatically labeled and scaled through our Kubernetes Clusters. Check out the recent blog post on Optimizing Kubernetes to reduce Flaky Tests. Throughout this blog, you will also learn that it is important to think about capacity planning and correct configuration of your containers and Kubernetes. Only this ensures that you can keep build times low and not be too impacted by slow, dynamic, and maybe over-provisioned infrastructure.
Before going into the details, I want to say thank you to Bernd Farka (@BFarka), Dietmar Scheidl and Wolfgang Gottesheim (@gottesheim) for sharing these details with me and letting me be their voice. Now lets start!
Lessons learned from the AppMon days
At DevOne® 2017, Wolfgang and Bernd already gave a great presentation on how they Moved from Scheduled to Commit Triggered Builds. Part of that presentation was the move towards Jenkins, but it was really about breaking the big monolithic code base into smaller components that could be built and tested independently and in parallel. That was a key to the speed up efforts. That learning obviously influenced what these guys are now doing for Dynatrace OneAgent!
Jenkins Setup for OneAgent: Kubernetes as Nodes
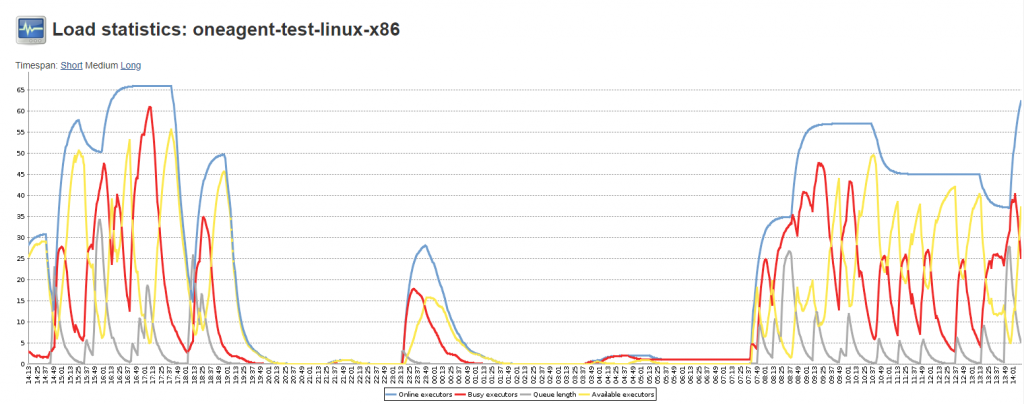
The team runs Jenkins behind an NGINX web server that provides HTTPS access. The Jenkins Replica Nodes, by default, are configured to run with a single executor. The reason for that is because these nodes run as containers in Kubernetes and thanks to the Jenkins Kubernetes plugin new nodes are automatically launched & destroyed based on demand and current utilization. Nodes are also labeled so that Jenkins understands which capabilities one of these nodes has, e.g: Linux, Windows, … These labels also come in handy when analyzing how many nodes and executors are currently running. Jenkins provides some basic charting of these metrics as shown on the following screenshot:
Jenkins Monitoring with Dynatrace
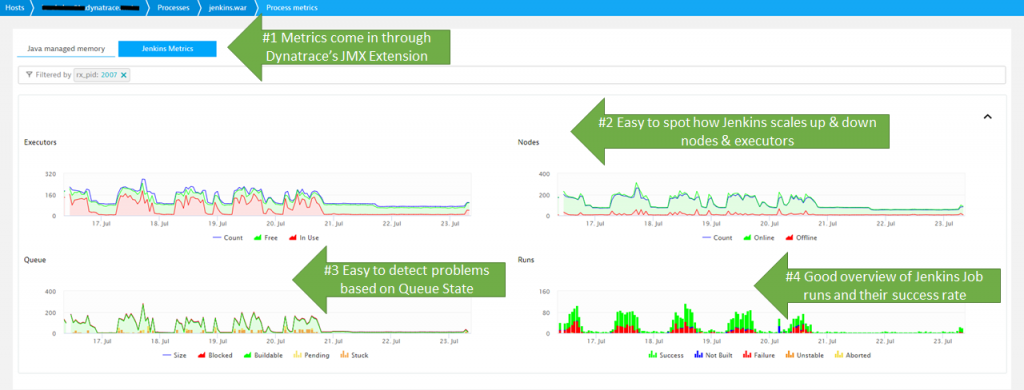
The team has also decided to monitor Jenkins and all its components with Dynatrace, as Dynatrace provides FullStack monitoring of Jenkins itself and every node that runs within a container managed by Kubernetes and the Kubernetes nodes as well – all with Dynatrace OneAgent. On top of that, the team is also pulling in the Jenkins metrics you saw in the previous screenshot into Dynatrace. Why? Because with that, they have all monitoring data in a single place and are able to leverage the same alerting and notification mechanism they already setup for infrastructure monitoring within Dynatrace.
There are couple of things to watch out for. As Jenkins will automatically spin up & down new Jenkins Nodes in Kubernetes, it is important that the Kubernetes Cluster is healthy. If the cluster is not healthy, it will take too long to deploy now Jenkins nodes which will slow down Jenkins job execution. Jenkins will always keep enough Nodes available but if you have spikes of new build requests you may run into an issue. That’s why it is important to analyze your development teams’ build patterns. This way you can make sure to provision enough nodes upfront when a “surge” is expected – OR – discuss different build execution strategies to “smooth out” job execution to avoid extreme spikes.
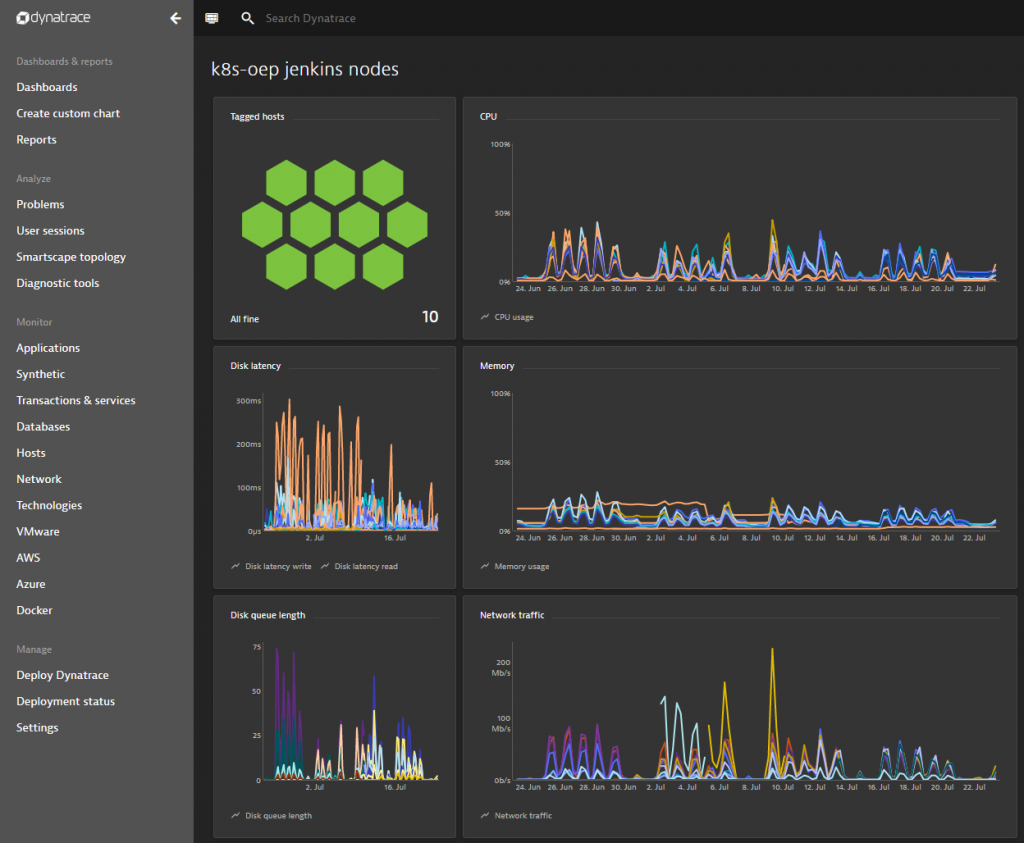
Another dashboard the team is looking at, is shown in the following screenshot. They use it to validate the overall health of the infrastructure supporting their Jenkins build pipeline. Key metrics for Wolfgang and team are host health, disk latency, network traffic and queue lengths:
There are many more metrics that Dynatrace captures out of the box. What’s important is that these are not just metrics to put on a dashboard, but metrics that get automatically validated against dynamic or static baselines. If an infrastructure issue occurs that impacts Jenkins service response time, the Dynatrace AI will automatically open a problem ticket. This can then lead to an automated Slack notification, a Jira ticket or any other form of notification. It could even result in an automated action that e.g: provisions more Kubernetes resources in case Jenkins cant deploy new Nodes fast enough on Kubernetes. This would then fall into what we call “Self-Healing”. More on this can be found in my blog on Auto-Mitigation or Self-Healing.
Key Hotspots in Jenkins!
After discussing the deployment and the monitoring of Jenkins lets have a quick overview about some of the hotspots they have detected and optimized so far!
Hotspot #1: CPU Spikes when merging Test Results
With 91,000 tests that get executed, we collect a lot of test results. The testing framework of choice is JUnit, which is used to execute the Unit-, Integration- and Component Tests. Too often the team noticed CPU spikes on the Jenkins server itself – leading to slowdowns in overall build throughput.
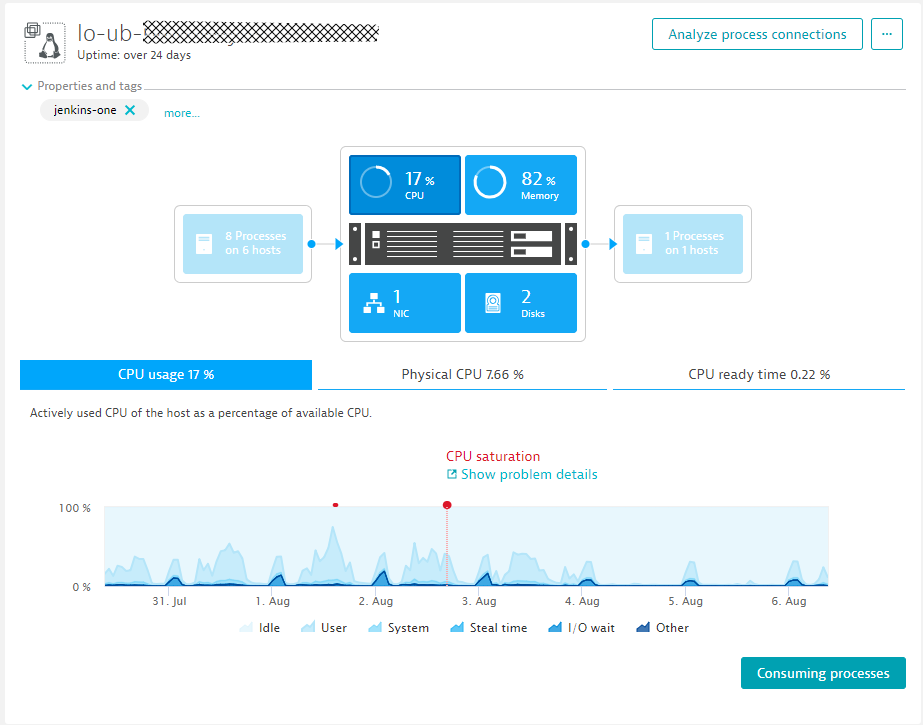
A click on “Consuming processes” immediately shows that it is really Jenkins that consumes the bulk of the CPU during such a spike:
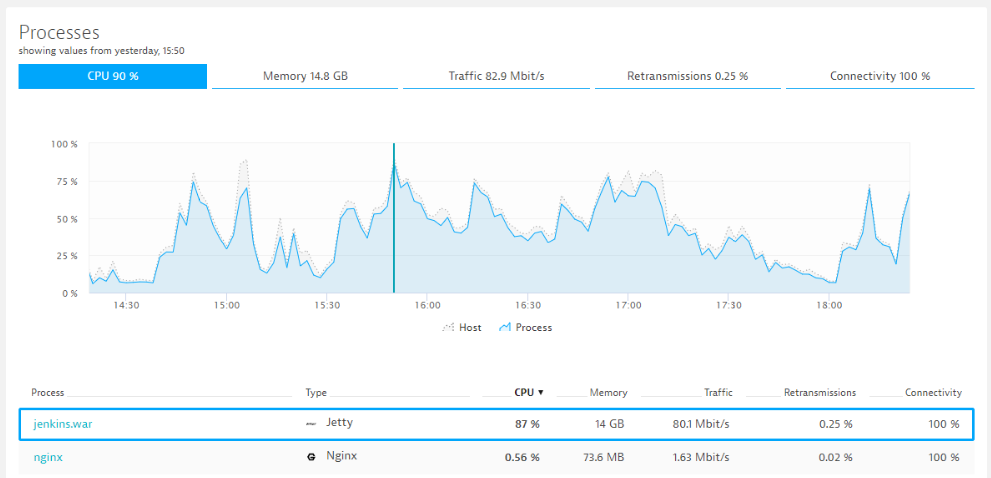
Another click on that process and a click on “Show CPU hotspots” brings us to the CPU hotspots. This view shows that most of the CPU is in fact consumed by the JUnit TestResultAction when merging results from different tests:
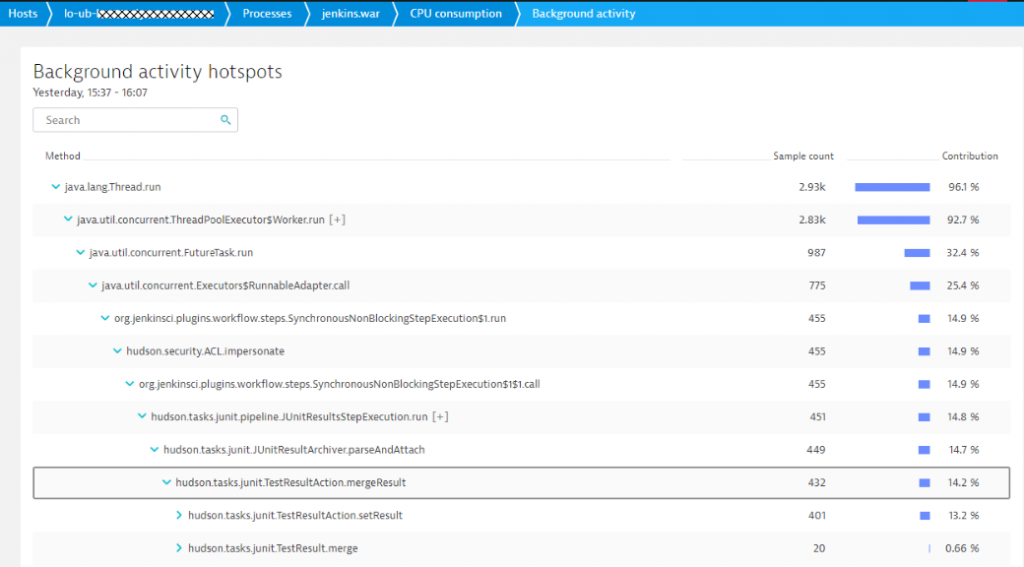
With this information, the team went through the JUnit result settings. Turned out that many of the tests had verbose test logging turned on or simply produced output that was not really needed by developers anyway. They went on to reduce the test results and with that managed to get CPU consumption down!
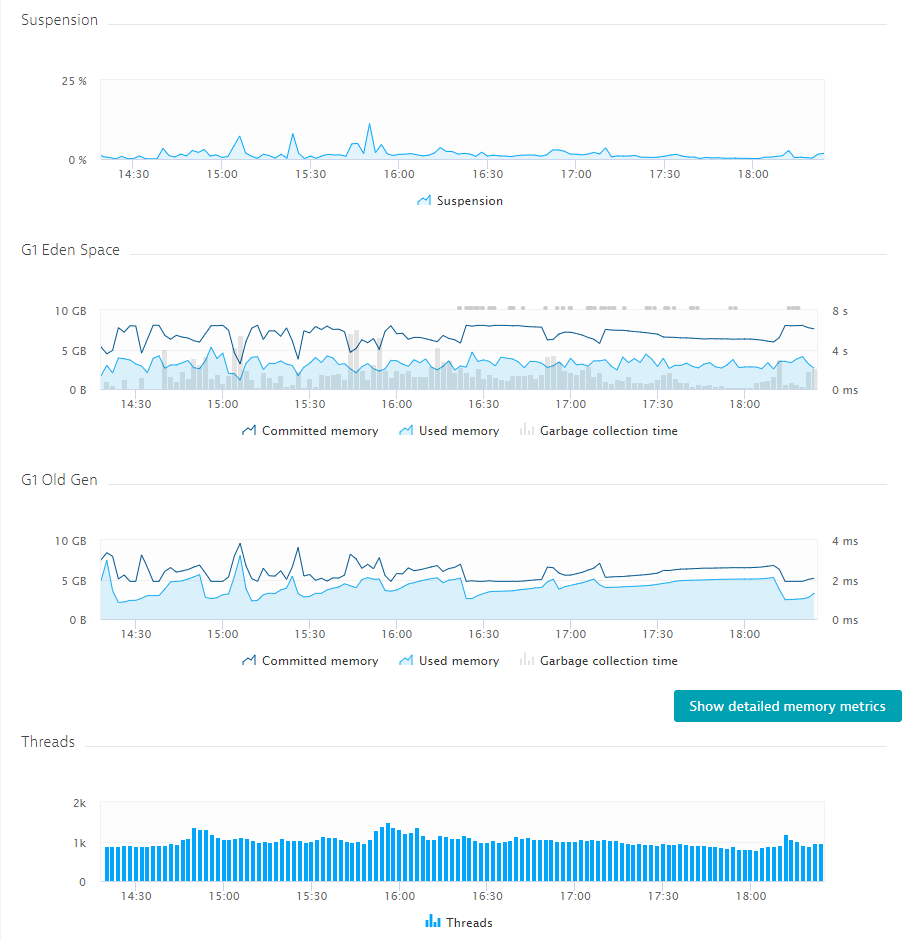
Hotspot #2: High Garbage Collection due suboptimal GC settings
Garbage collection is typically a tricky thing – especially because there is not always a “one setting fits all scenarios” guidance. The team constantly keeps an eye on all the key memory metrics. They then either start adjusting and optimizing JVM memory and GC settings or try to find the offending parts of Jenkins (maybe a bad plugin, maybe another large test result merge) and try to reduce the memory footprint. A start for them however are the out-of-the-box memory metrics captured by Dynatrace:
For more information on Java Garbage Collection, check out our Online Java Performance Book and the chapter from Michael Kopp on Memory Management. Also make sure to consult the Jenkins doc pages where you find recommendations on how to properly size your Jenkins instances.
Hotspot #3: Bad End User Experience
The first two hotspots not only impact the speed and throughput of the actual build pipelines. It also impacts the user experience of all engineers that want to check their build status or download their latest build results or log files.
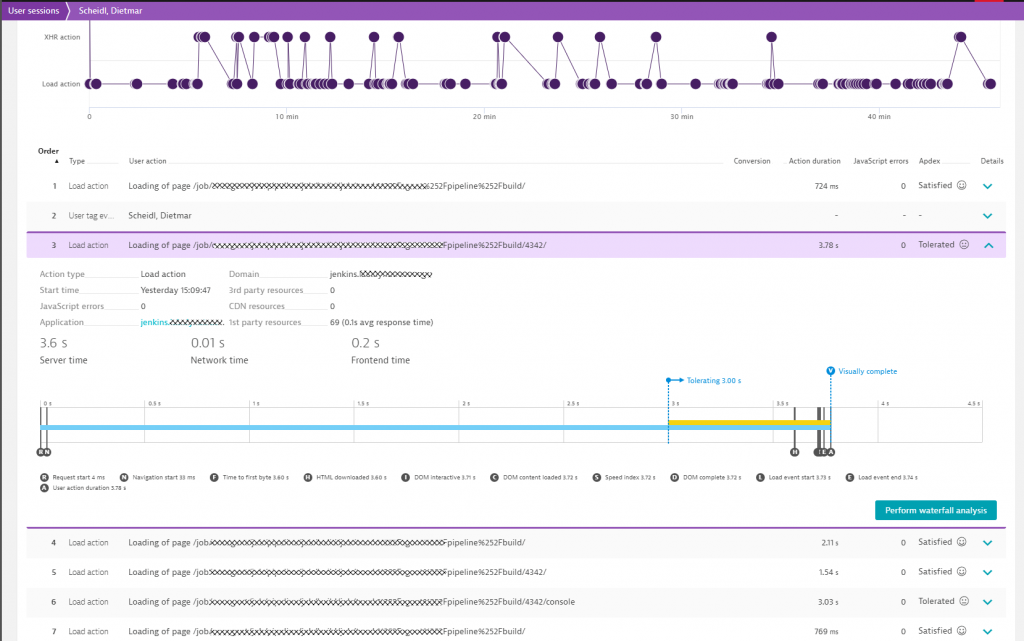
As Dynatrace automatically enables Real User Monitoring (RUM), the team can find hotspots of within individual Jenkins web interface screens that sometimes leads to frustration of engineers. Having this data available for every single user and every single navigation action allows them to see where the real user experience issues are. It often boils down to analyzing very large build results in the UI or navigating through screens that simply have a lot of configuration elements that have to be loaded from the Jenkins server and rendered in the browser. If this happens at the same time when the Jenkins server is overloaded with merging test results or when a GC run kicks in, it multiplies the negative impact on the end user. Here are a couple of screenshots showing how they analyze actual real user experience when working with Jenkins. We are actually looking at a session from Dietmar Scheidl, one of the guys who told me the story to this blog:
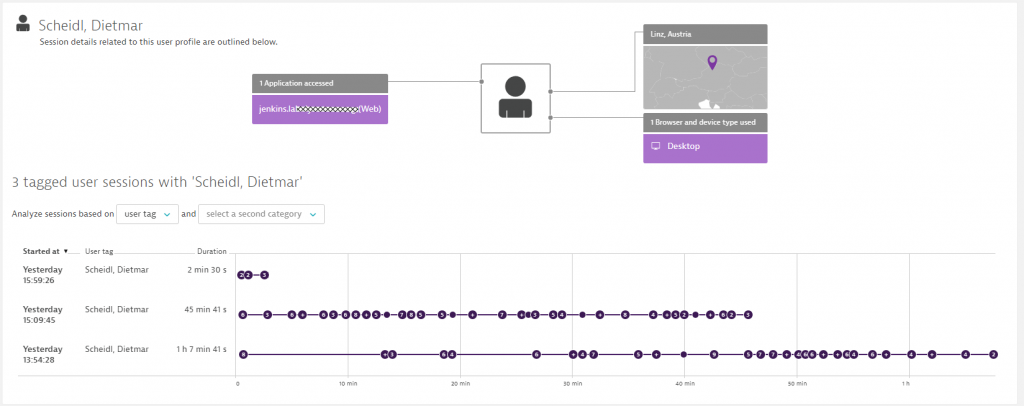
Dynatrace RUM then allows them to see every single interaction, which ones caused a client-side error such as a JavaScript error or HTTP error response, and which ones simply took a long time and we get to analyze where that hotspot is:
When I had a stroll through the RUM data, I observed that some engineers are kicking off builds and then constantly refreshing certain Jenkins screens as they are waiting for build results. With the several hundred engineers that we have, this could potentially lead to additional problems. I therefore recommend analyzing and identifying these types of browsing behavior and provide a better solution for these engineers, e.g: a slack notification when the data they are expecting is ready. That reduces the pressure on the Jenkins UI and is better for your CPU, Memory and Network!
Summary: Key Metrics to keep Jenkins Builds fast
There are a couple of things that the team is constantly monitoring and optimizing to keep the Jenkins build pipeline fast, reliable and Jenkins overall fast enough to not negatively impact those browsing the web interface. What I’ve learned when talking with the Engineering Productivity Team is the following
- Using Kubernetes for Dynamic Jenkins Node & Executor Provisioning is great!
- Make sure to not overutilize your Kubernetes clusters as it will slow down your build times as discussed in more details in the “Flaky Tests on Kubernetes” blog post
- Constantly evaluate your CPU and Memory hotspots in Jenkins! Reduce CPU hogs such as Test Result Merging!
- Learn how your engineers are navigating through Jenkins. What information are they looking for? Maybe you can automatically provide that information for them once – instead of them having to re-check the Jenkins Web UI multiple times and with that causing extra load!
- Eventually start thinking to break your projects into multiple Jenkins servers instead of having one huge installation to maintain and optimize
Start a free trial!
If anyone is interested in trying Dynatrace on their own Jenkins installation simply sign up for a Dynatrace Trial.

Looking for answers?
Start a new discussion or ask for help in our Q&A forum.
Go to forum