
Atlassian provides a well-integrated set of tools that improve collaboration and provide continuous feedback along the software delivery cycle. It allows engineering teams to plan and push code changes, leveraging automation continuously all the way into production. Implemented and maintained correctly, it’s a well-oiled humming machine that ensures engineering productivity and optimizes two key metrics for business: Time to Market and Time to Adoption of new features.
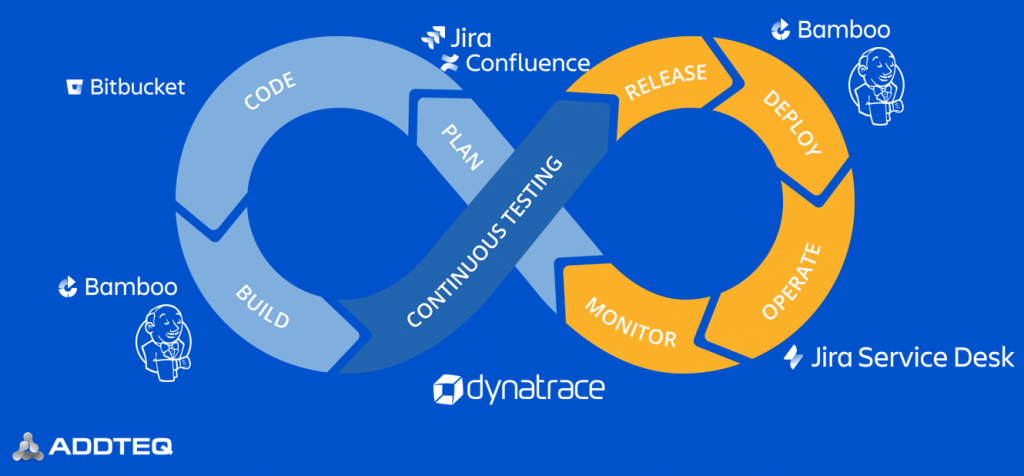
But just as in the “real” world, engines must be monitored, oil must be changed, and bolts must be adjusted from time to time to keep that engine running. In my most recent performance clinic, I invited Himanshu Chhetri, CTO at our partner Addteq, to show us how Addteq helps enterprises implement DevOps Best Practices leveraging Atlassian, Dynatrace and other important tools along the DevOps Tool chain:
Let me summarize the four use cases Addteq showed on how they use Dynatrace to ensure Atlassian tools are not degrading in performance, scale with their adoption and are always providing excellent engineering productivity:
- Slow Jira is impacting individual power users
- Optimize Confluence & Jira for majority of your users
- Slow Bamboo or Bitbucket will impact every piece of the pipeline
- Dynatrace A.I. detected a problem with Jira failure rate increase
#1 – Slow Jira is impacting individual users
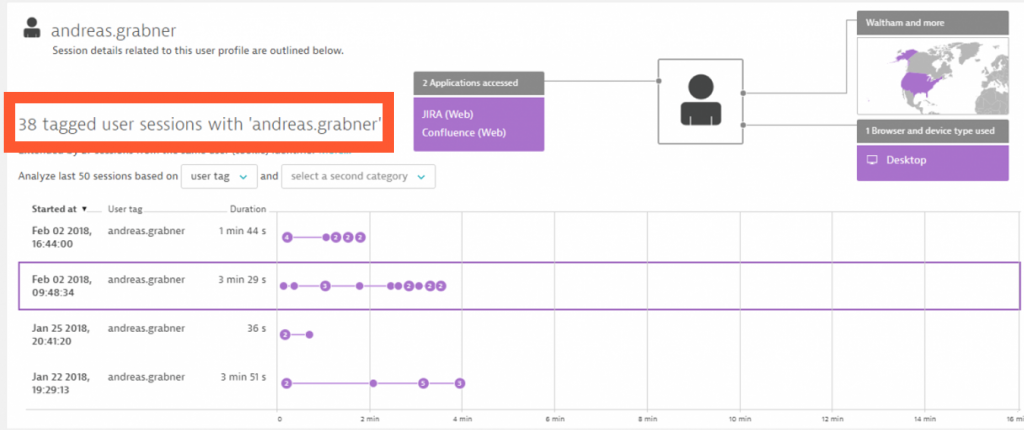
Once Dynatrace OneAgent is installed on the host that runs JIRA, we get visibility into the Tomcat that runs JIRA, the database that is used by Jira as well as Real User insights for every single Jira user starting from within their browser. If a single user complains – like “andreas.grabner” (yeah – that’s me) in the example below – we can simply open up all monitored user sessions from this user by typing in the user name:
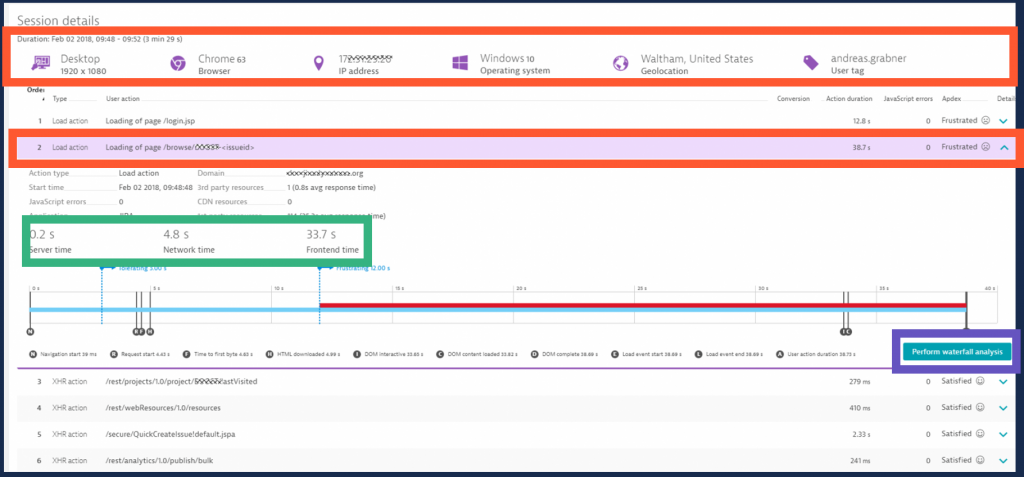
A closer look at a user’s session details shows every single click, the time it took to load that page, where the time was spent and gives you the option for full end-to-end waterfall analysis:
Quick recap. Use Dynatrace on Jira & Confluence to:
- Understand how individual users navigate through your Atlassian Tools
- Learn whether slowness or errors are caused by unsupported browsers, bad connection, bad page layout, overloaded pages or backend issues
- Fix problems that impact productivity of your power users
#2 – Optimize Confluence & Jira for majority of your users
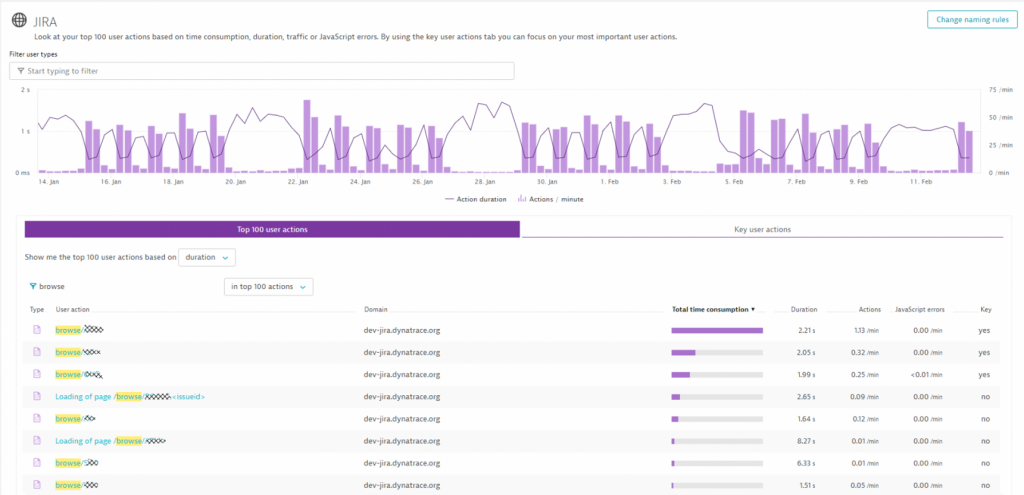
Besides fixing issues for individual power users, the goal must be to optimize your systems where it has the biggest positive impact. In the performance clinic, Addteq therefore showed how we can use Dynatrace RUM data to understand which pages are used most frequently, which of these are the performance hotspots, why these pages are slow and who is using them.
For more information read my blog about Optimizing Atlassian Jira and Confluence Productivity with Dynatrace.
Quick recap. Use Dynatrace on Jira & Confluence to:
- Understand global usage and navigation patterns through all your Atlassian Tools
- Learn whether slowness or errors are caused by unsupported browsers, bad connection, bad page layout, overloaded pages or backend issues
- Fix problems that impact the productivity of the majority of your users
#3 – Slow Bamboo or Bitbucket will impact every piece of the pipeline
When using Bamboo, chances are high that Bamboo is well integrated into all other tools, e.g: JIRA, or Bitbucket via the available API endpoints. If only one API endpoint slows down it can have a ripple effect slowing down pipeline execution time, defers feedback to engineers and eventually impacts engineering productivity.
During the performance clinic Himanshu from Addteq showed how the Dynatrace AI automatically detected a slowdown of Bamboos REST endpoints from 100ms to 300ms. This is a factor 3 which can have devastating consequences if not detected and addressed fast.
During the performance clinic Himanshu and I discuss all the potential impacts a slow API can have. Make sure to listen through the whole thing if you are interested.
Quick recap. Use Dynatrace on Bamboo to:
- Understand the dependencies of other tools in your ecosystem
- Learn what is impacted by slowness or errors
- Fix problems before they impact pipeline performance and productivity
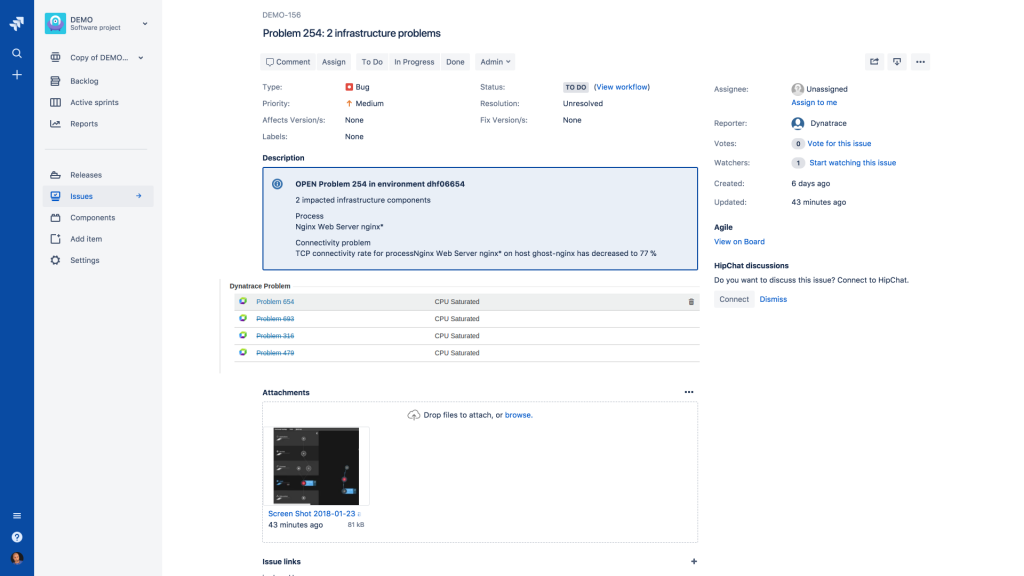
#4 – Dynatrace A.I. detected a problem with Jira failure rate increase
Errors and failures are not always visible because some of them happen on API calls and might not be reflected back to the web UI. This could also lead to situations where a user “thinks” a certain action was successfully executed but in fact it was not.
The following animation shows the power of Dynatrace Root Cause detection as it points to the actual SQL Query that failed due to an incorrect character encoding that was used when creating a Jira comment through the API. No need to dig through database logs, exception logs or web server logs and manually correlating all this information. Dynatrace has this data available in a single problem ticket:
Knowing the API call that was used to trigger that failing SQL statement allows us to fix any configuration errors that lead to that incorrect passing of REST API payload data. If the Jira API was used by our own custom-built integrations or tools it is good to know that we are using them wrong and cause issues. Having this level of visibility and automatic root cause analysis is a win/win situation for everyone. Most importantly though for the engineers that use the integrated tool chain.
Quick recap. Use Dynatrace to:
- Detect any failures in any API call
- Fix the issues of whoever uses the APIs wrong
- Optimize your configuration and hardware based on API usage. The more integrations you enable the more you need to consider proper scaling
From re-active to pro-active error handling
Having Dynatrace that helps us diagnose issues must faster is great – but the real goal must be to move from re-active error analysis to pro-active error prevention. A step towards that is using Dynatrace’s capability to automatically create Jira tickets every time the Dynatrace AI detects a problem. Kind of ironic though that Dynatrace might create a Jira ticket if your Jira has an issue 😊
Dynatrace has a built-in integration to create Jira tickets through the Jira REST API. As Addteq is a premium Atlassian partner with lots of experience to build extensions to Atlassian products they went ahead and built a new JIRA Server plugin that provides a couple of very useful productivity features when it comes to incident management:
- Easier to understand Dynatrace problem description in JIRA
- LIVE problem status in your Jira tickets
- Direct links to our Dynatrace dashboards from JIRA
- Link Jira tickets to existing Dynatrace Problems
- Link multiple problems to a single ticket
- …
More to come …
The more we talk about the importance of monitoring throughout the DevOps Toolchain the more feedback and new ideas we get from companies that use Atlassian and Dynatrace. Addteq is committed to take these ideas and extend the existing integrations with the most important use cases, e.g: linking any Dynatrace Entity (host, process group, service, application, user action, …) to a Jira ticket to get LIVE key metrics in Jira for e.g: a feature you are working on or a change request you confirmed!
If you have any questions, if you want to advise from Addteq or Dynatrace then simply reach out to our teams.


Looking for answers?
Start a new discussion or ask for help in our Q&A forum.
Go to forum