
Most modern companies have built their digital transformation strategies atop cloud-native stacks that simplify and streamline microservices deployments. Kubernetes and Cloud Foundry-based offerings share most of this market and are great platforms for operating cloud-native workloads. While Cloud Foundry is ideal for running pure microservices applications—and keeping the complications of containerization away from your users—Kubernetes-based offerings are ideal for running self-built containers, including non-application containers.
Many of our customers end up working with a mixture of platforms provided by hybrid-cloud vendors. In this blog post I’ll explain the following key use cases that we’ve seen our customers demand from their monitoring solutions so that they can manage their technology stack-diverse environments:
- Monitoring of distributed applications across cloud-native platforms
- Tracing across hybrid-cloud environments and providers
- Managing monitored entities based on your organizational structures and processes using Management zones.
- Distributed tracing and diagnostics across technology and service boundaries
AWS hosting Cloud Foundry; GCP hosting Kubernetes
In the following example scenario, we’ve deployed a Cloud Foundry environment on Amazon Web Services and a Kubernetes cluster on Google Cloud Platform. In the Cloud Foundry environment, we run the EasyTravel demo application to showcase how microservices deployments look in Cloud Foundry and how to automatically separate staging and production deployments of EasyTravel within Dynatrace. Cloud Foundry Application Runtime isn’t the ideal place to host databases and other data-persistence layers, so we run a MongoDB in the Kubernetes cluster. In Kubernetes we’ve also set up a load generator to drive load for the EasyTravel demo application.
Dynatrace cloud-native monitoring is part of every platform
In cloud-native environments, you can make full use of the strength and power of Dynatrace if OneAgent is deployed to the underlying infrastructure (for example, Kubernetes nodes and Cloud Foundry VMs). In our scenario we used the Dynatrace BOSH addon to automatically roll out OneAgent to every new BOSH managed VM, including Kubernetes and Cloud Foundry VMs. In doing so we reduced the mean-time-to-instrumentation to nearly zero.
Every new Kubernetes cluster will be monitored with Dynatrace automatically, with no further action required.
$ pks create-cluster cluster1 --external-hostname cluster1.foo.bar.dynatracelabs.com -p small -n 2

Name:                     cluster1
Plan Name:                small
UUID:                     4073031a-075e-4313-89ba-cb435b8a3d51
Last Action:              CREATE
Last Action State:        in progress
Last Action Description:  Creating cluster
Kubernetes Master Host:   cluster1.foo.bar.dynatracelabs.com
Kubernetes Master Port:   8443
Worker Instances:         2
Kubernetes Master IP(s):  In Progress
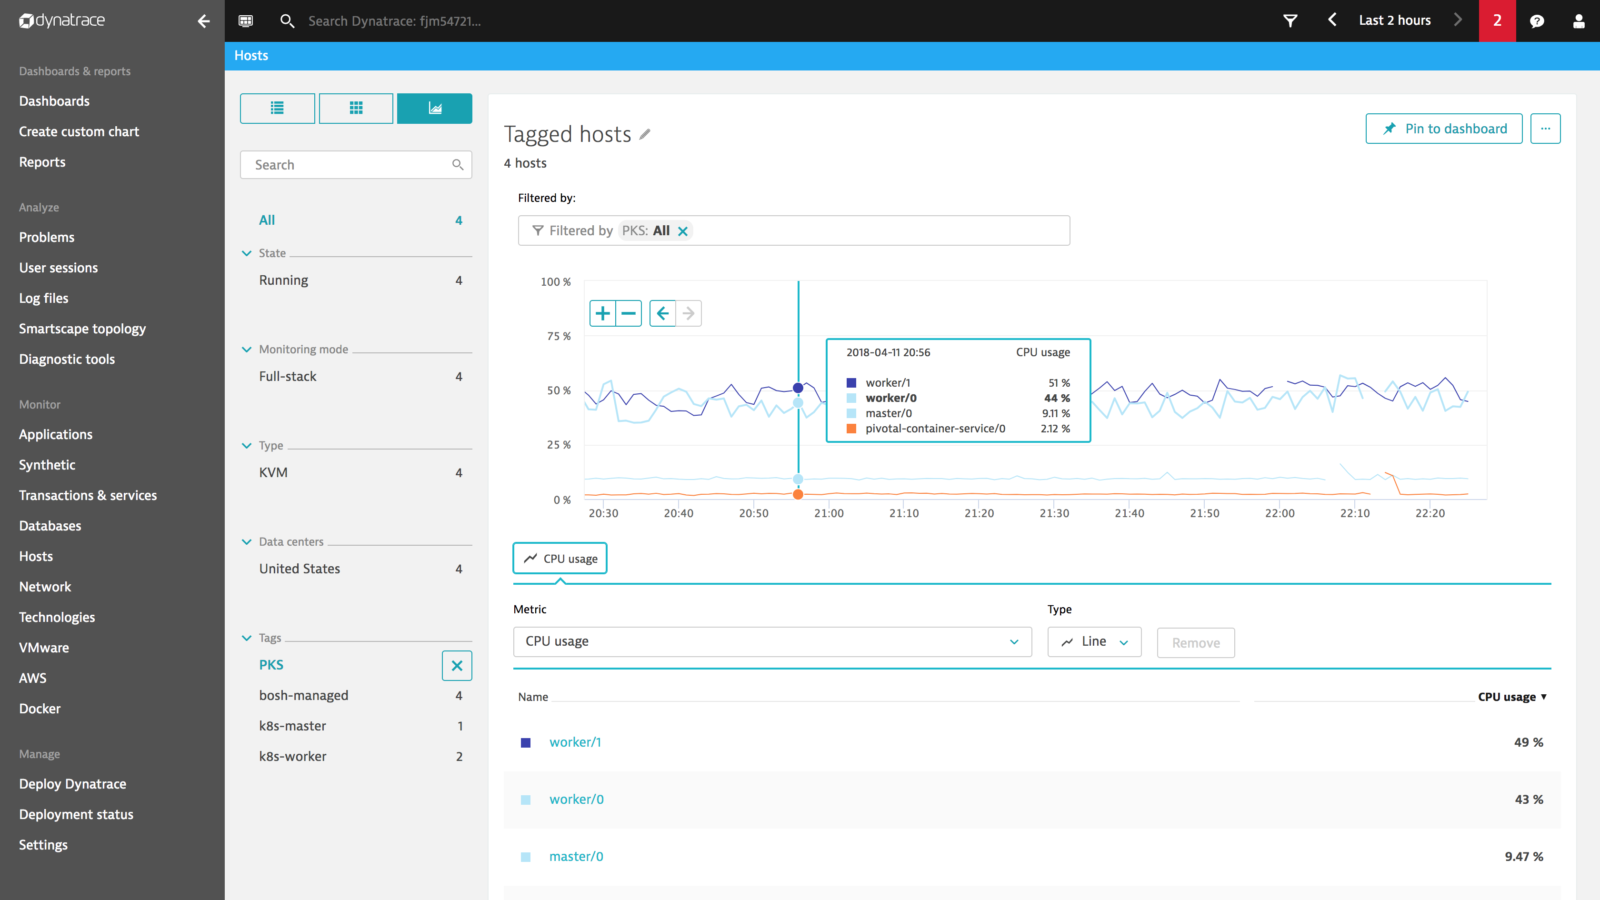
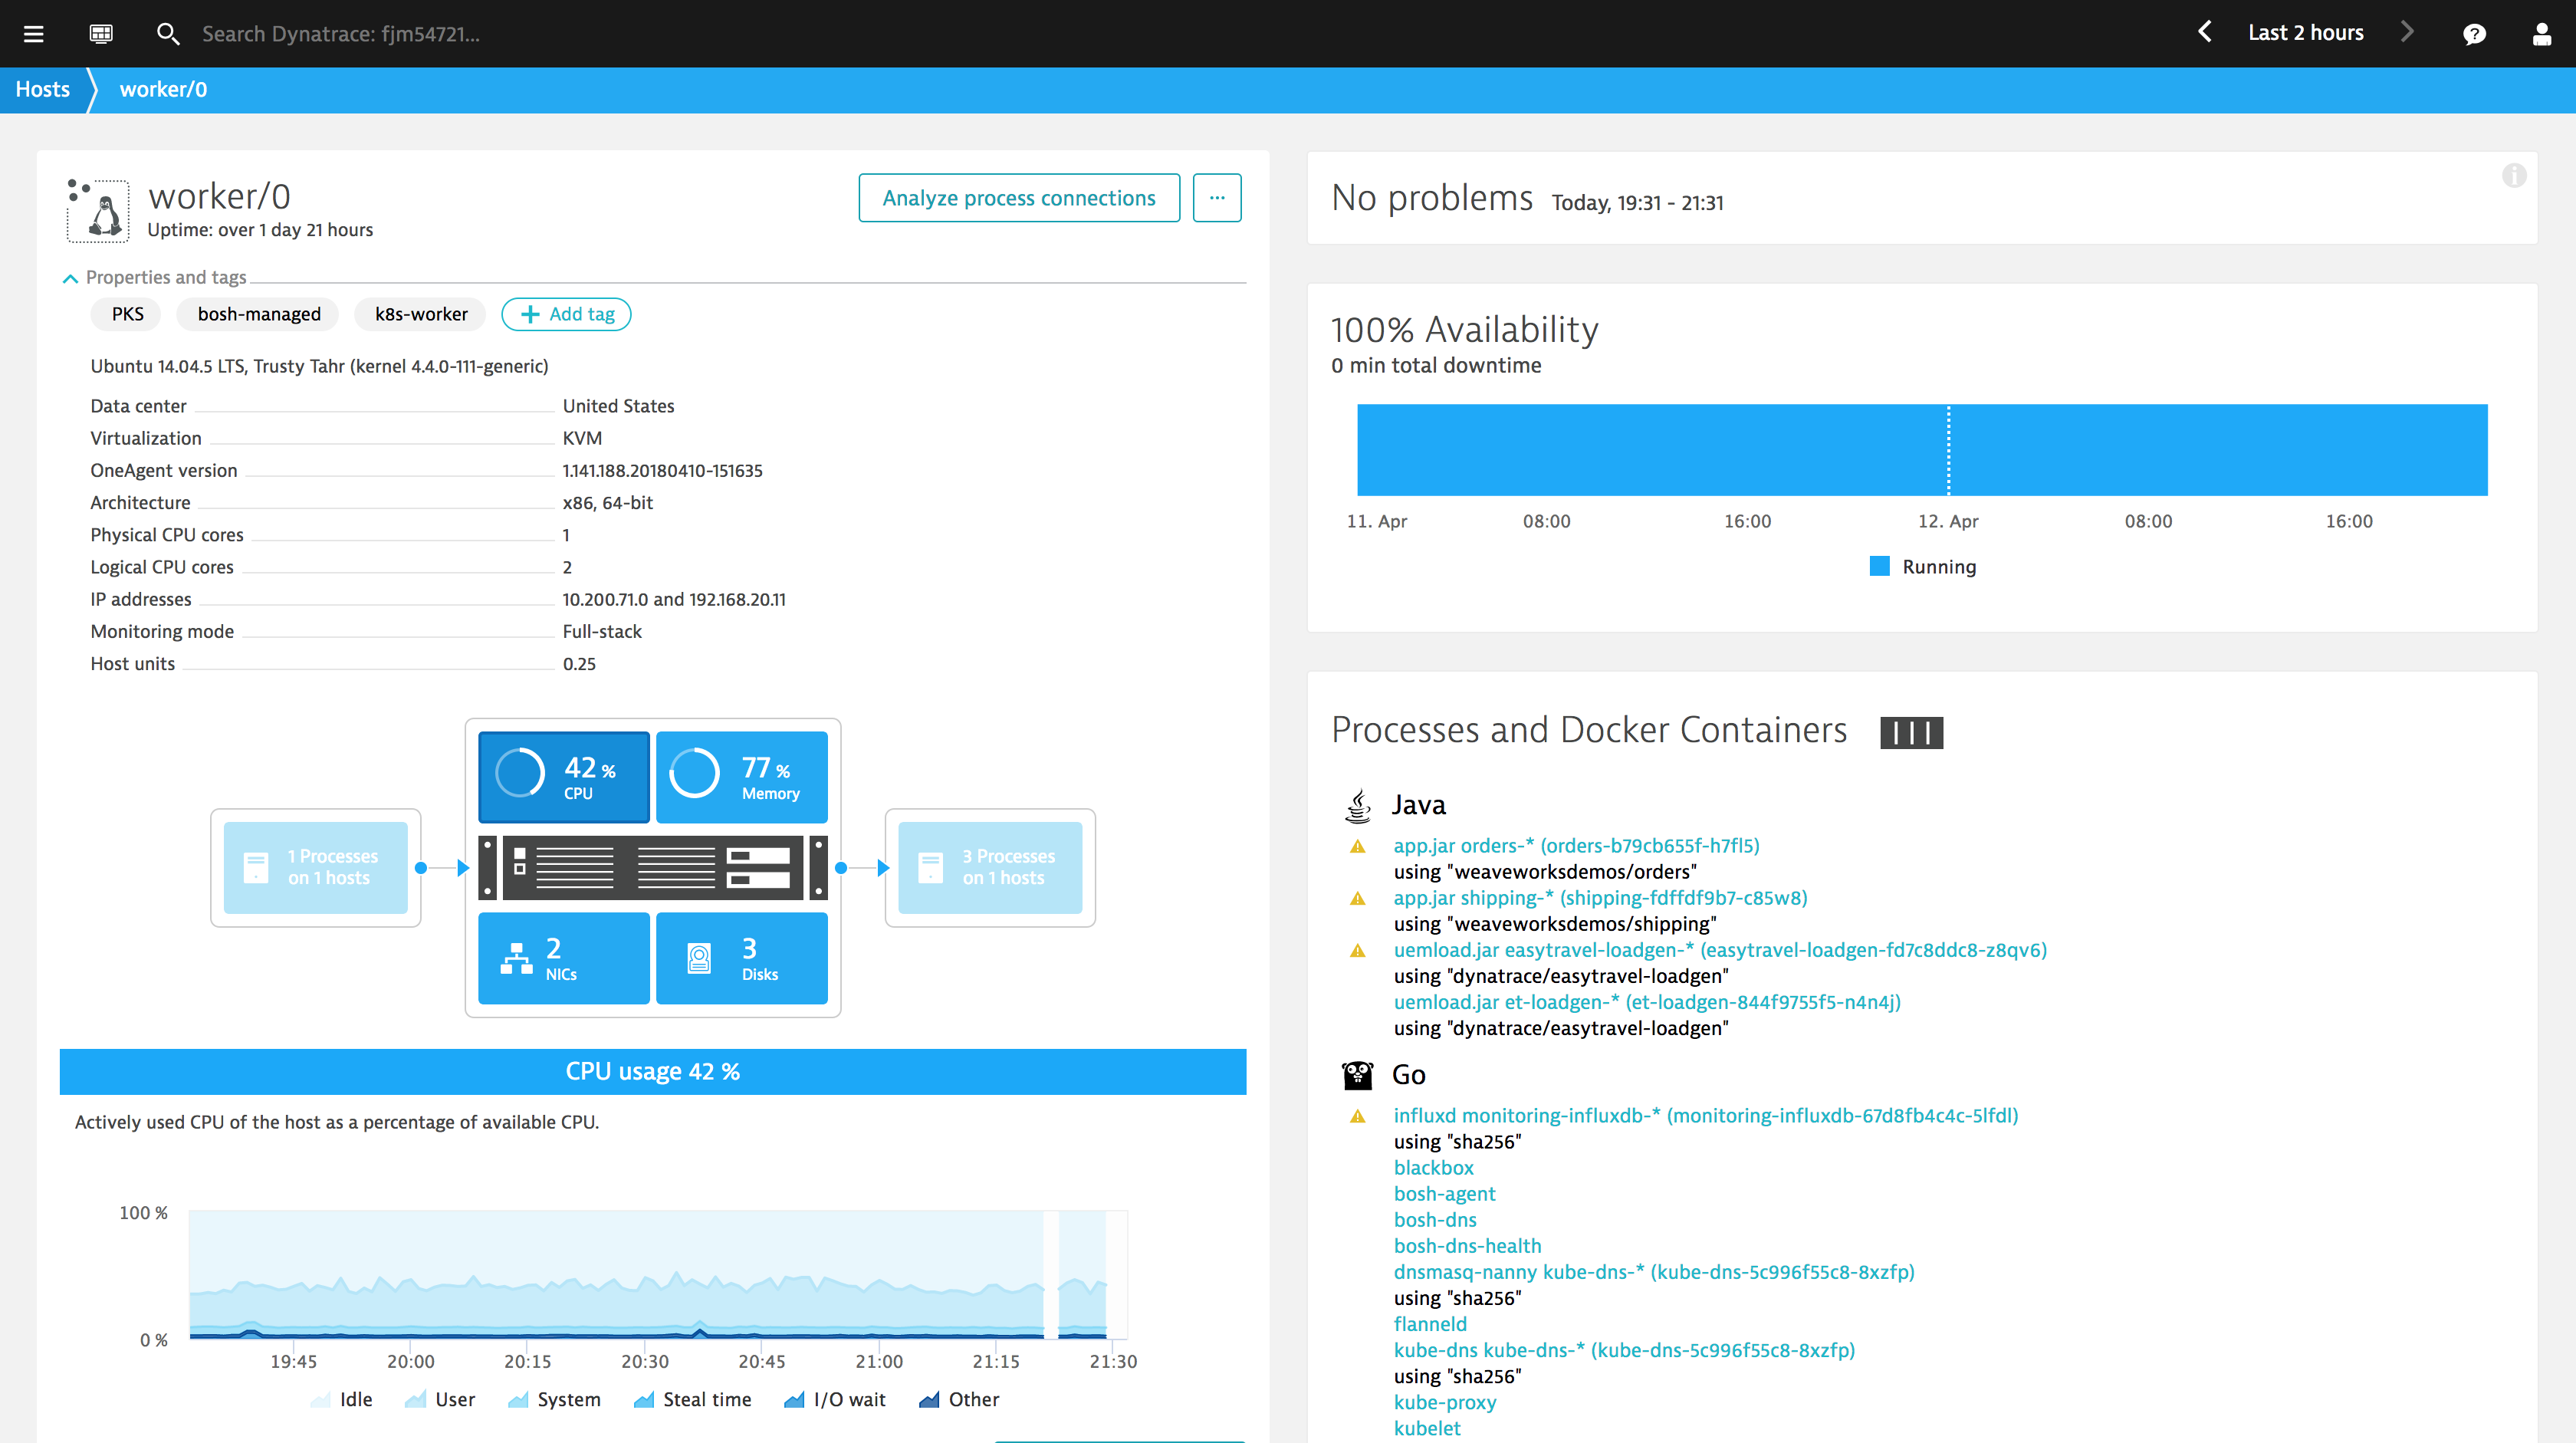
OneAgent automatically discovers all processes running on the worker nodes and begins monitoring the containerized applications right away.
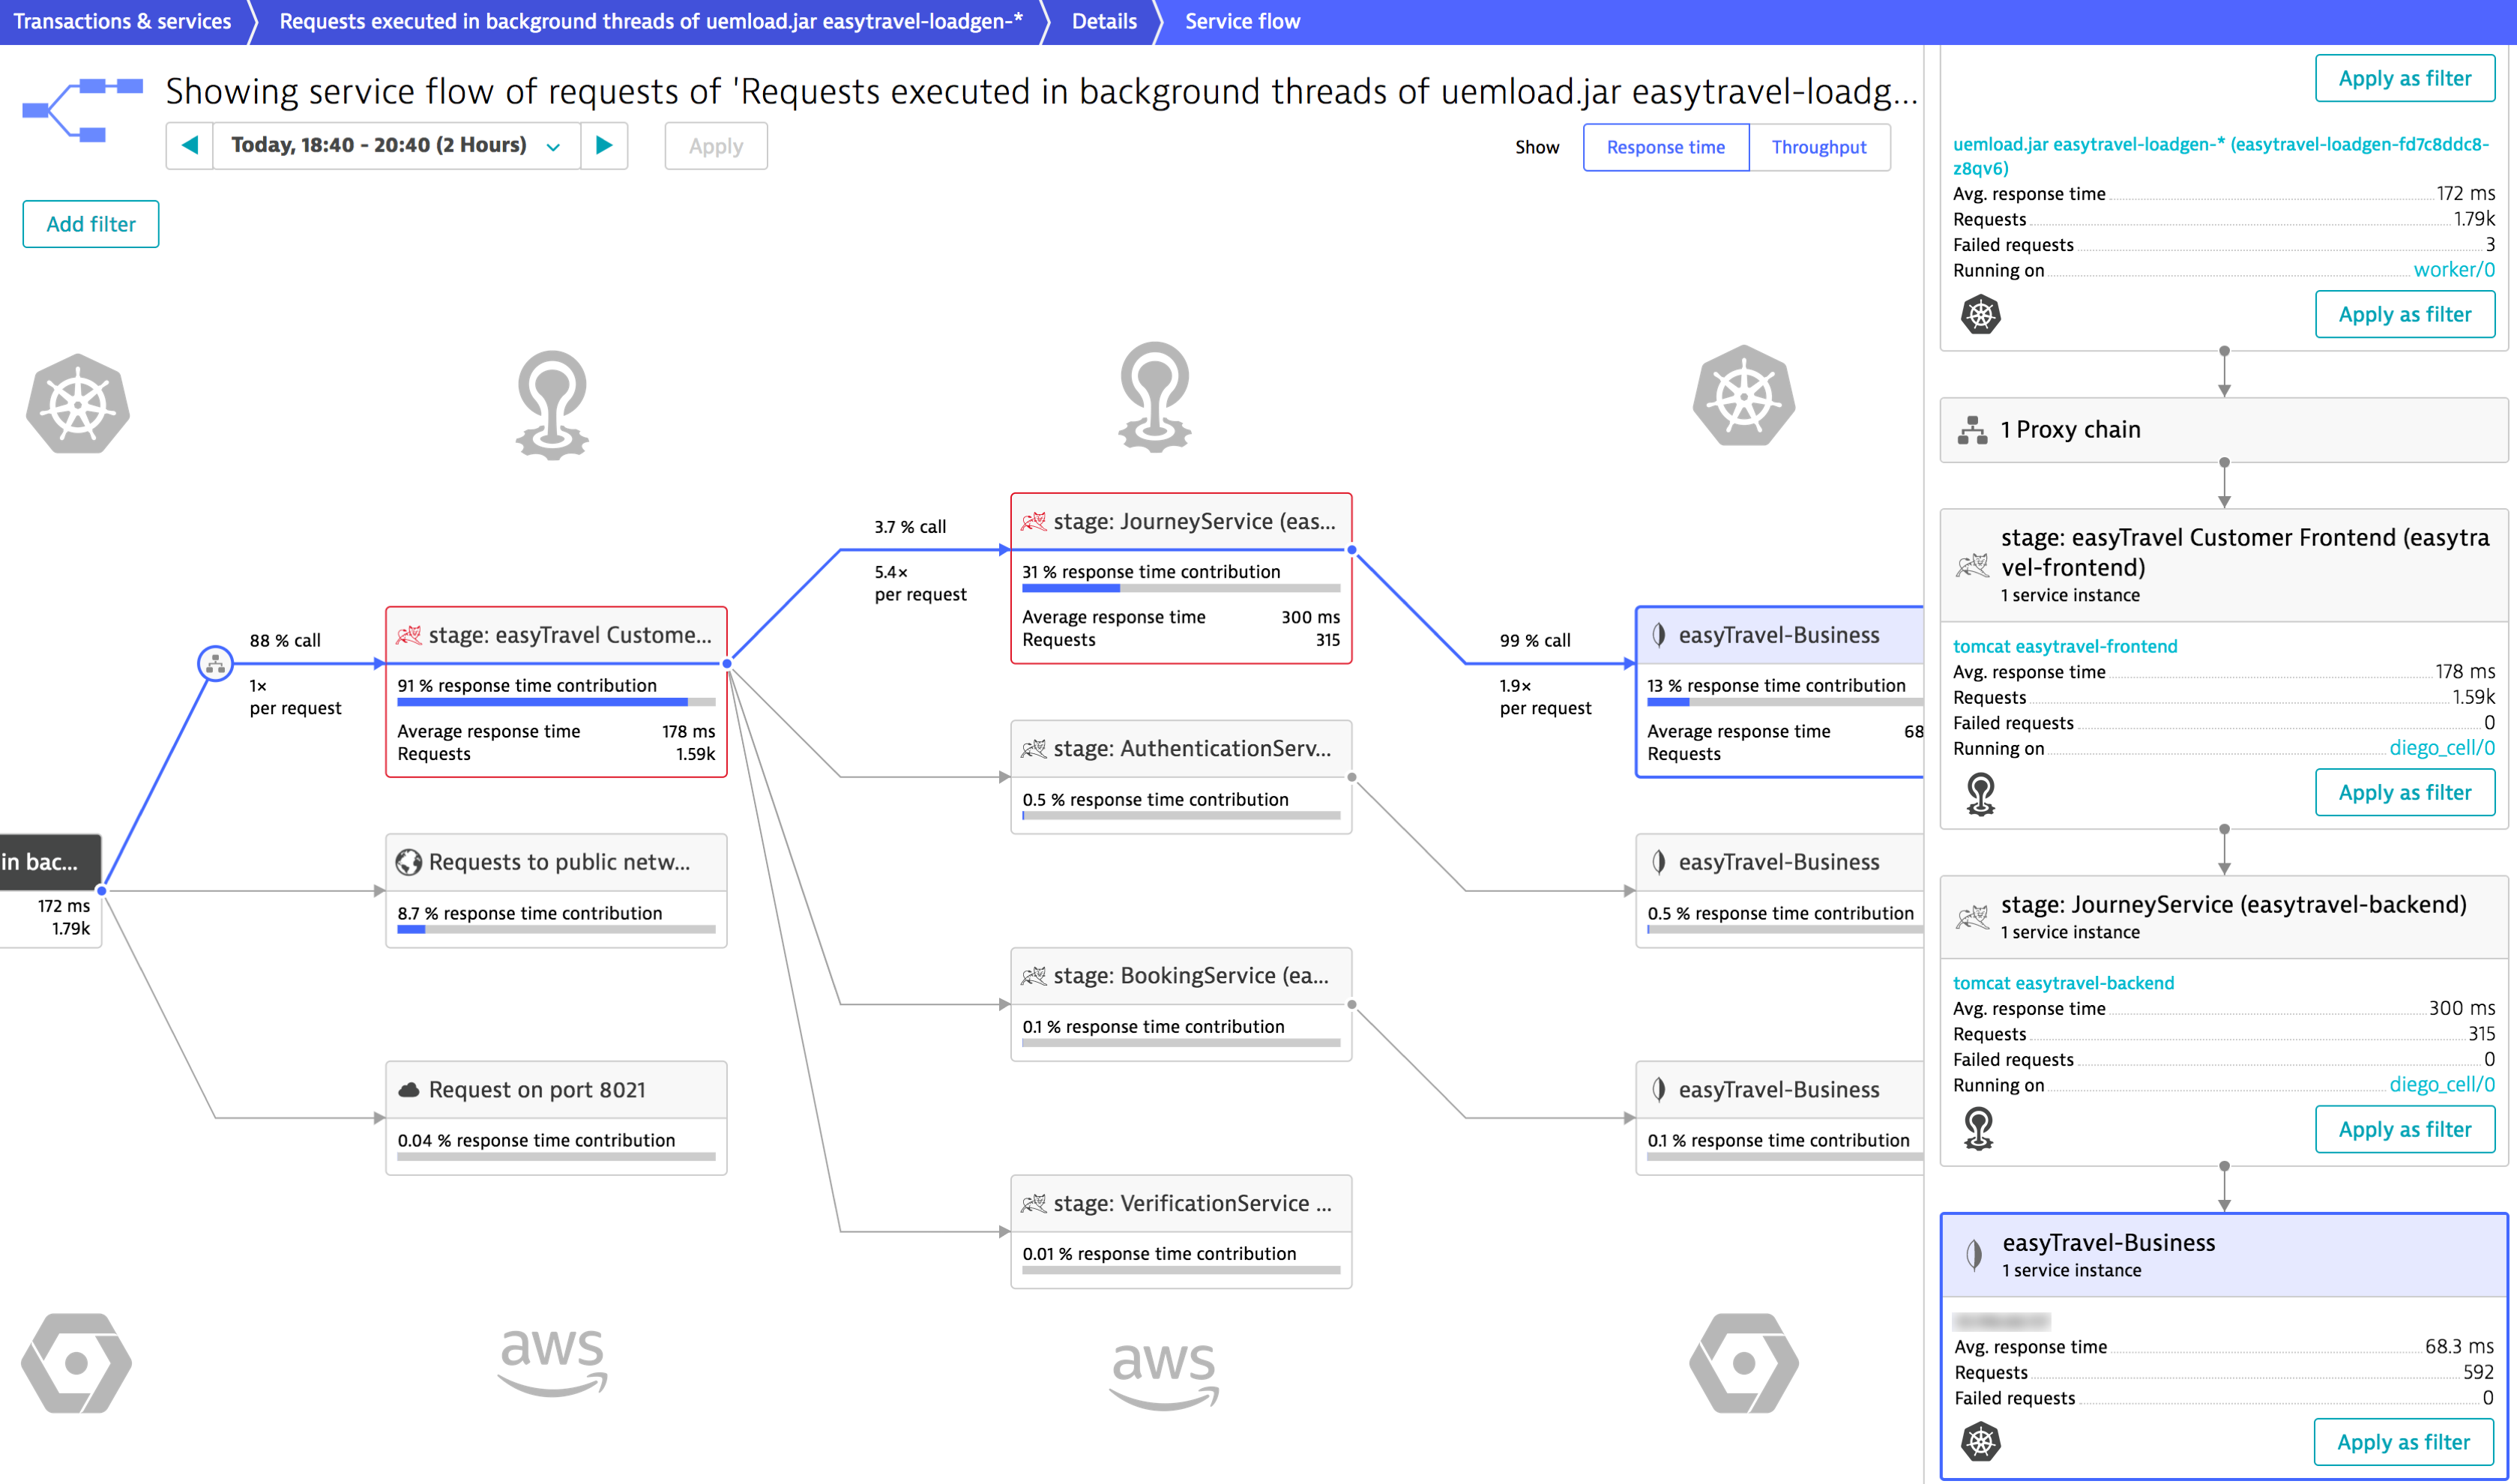
Tracing transactions across data centers, from Cloud Foundry to Kubernetes (and vice versa)
The Dynatrace auto-injection capabilities for Docker and runc-based containers allow you to automatically monitor all deployed applications and microservices. This means you don’t need to bother with instrumenting individual apps and microservices—these are monitored out-of-the-box to enable gap-free visibility. This allows organizations to gain deep insights into microservices performance, service interactions, and 3rd party performance within distributed systems. You can automatically detect performance problems across multi-cloud stacks and optimize microservices deployments.
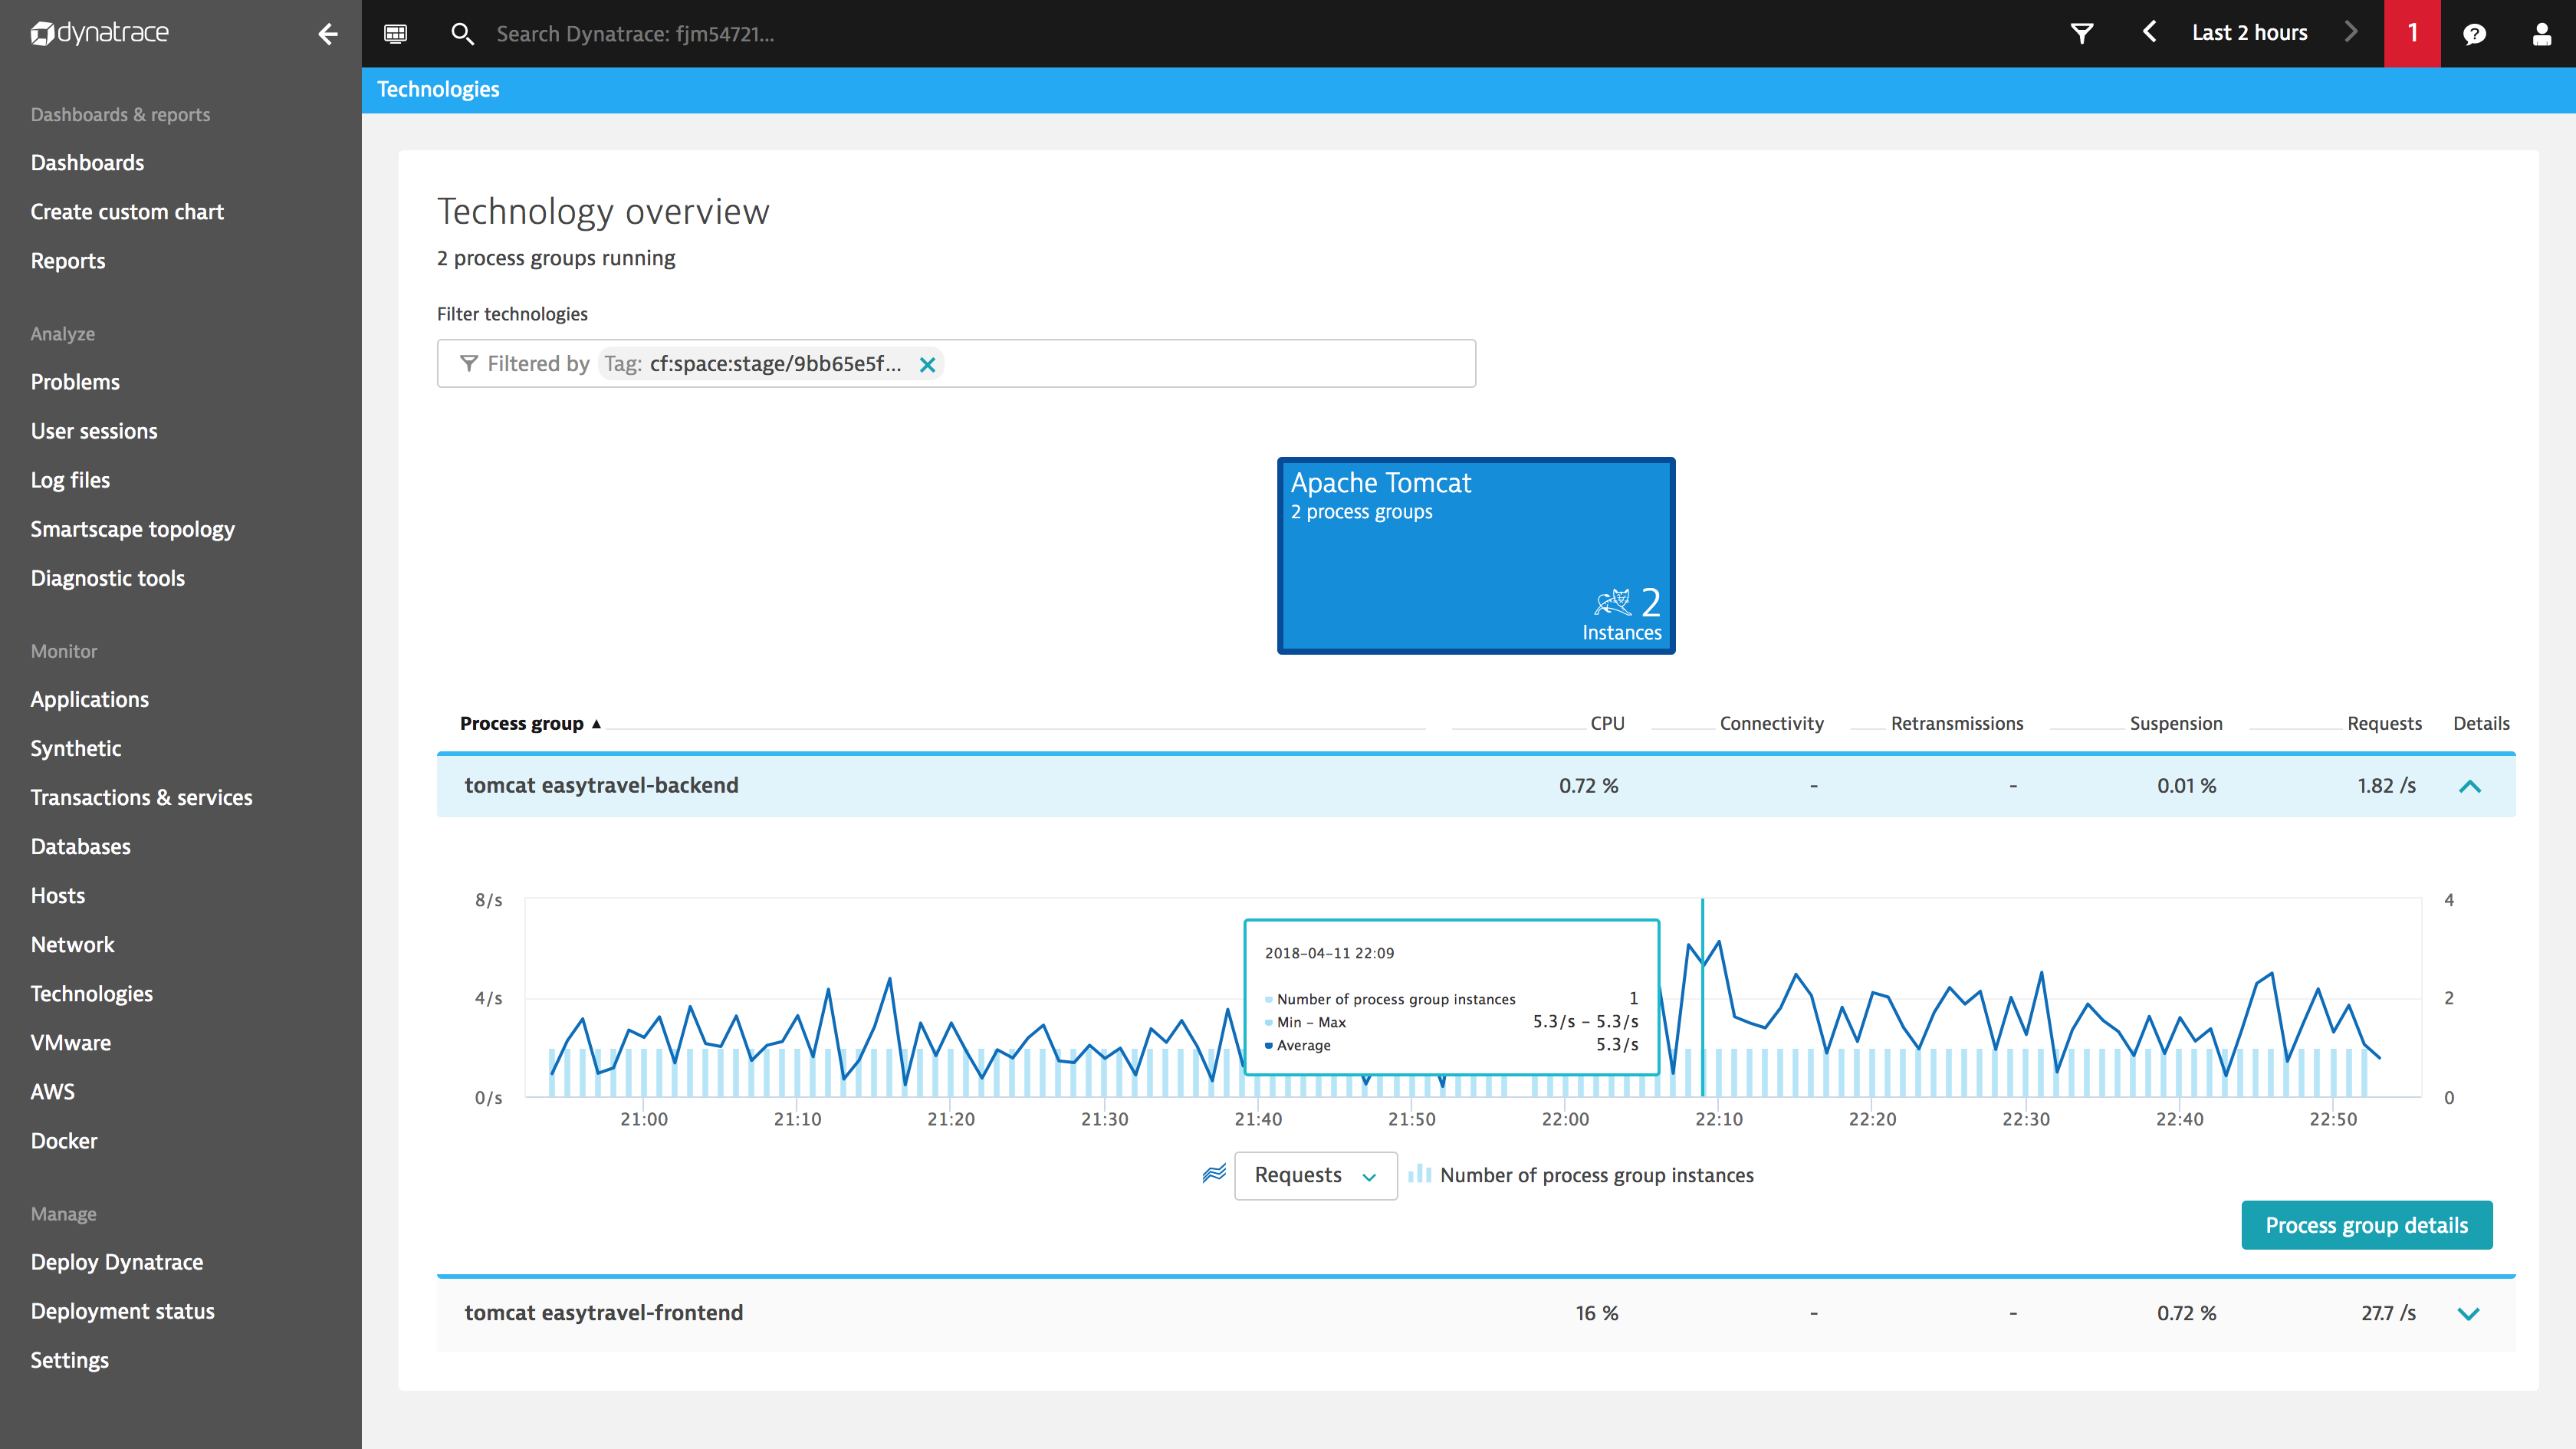
The two EasyTravel apps deployed to Cloud Foundry in our environment look like this:
$ cf a
Getting apps in org easytravel / space stage as alois...
OK

name                  requested state   instances   memory   disk   urls
easytravel-backend    started           1/1         768M     1G     eb-stage.apps.foo.bar.dynatracelabs.com
easytravel-frontend   started           1/1         768M     512M   ef-stage.apps.foo.bar.dynatracelabs.com
The MongoDB database and load generator for EasyTravel both run within Kubernetes pods.
$ kubectl get pods -n easytravel
NAME                                  READY     STATUS    RESTARTS   AGE
easytravel-loadgen-fd7c8ddc8-z8qv6    1/1       Running   0          1d
easytravel-mongodb-57b855b577-s86fm   1/1       Running   0          1d
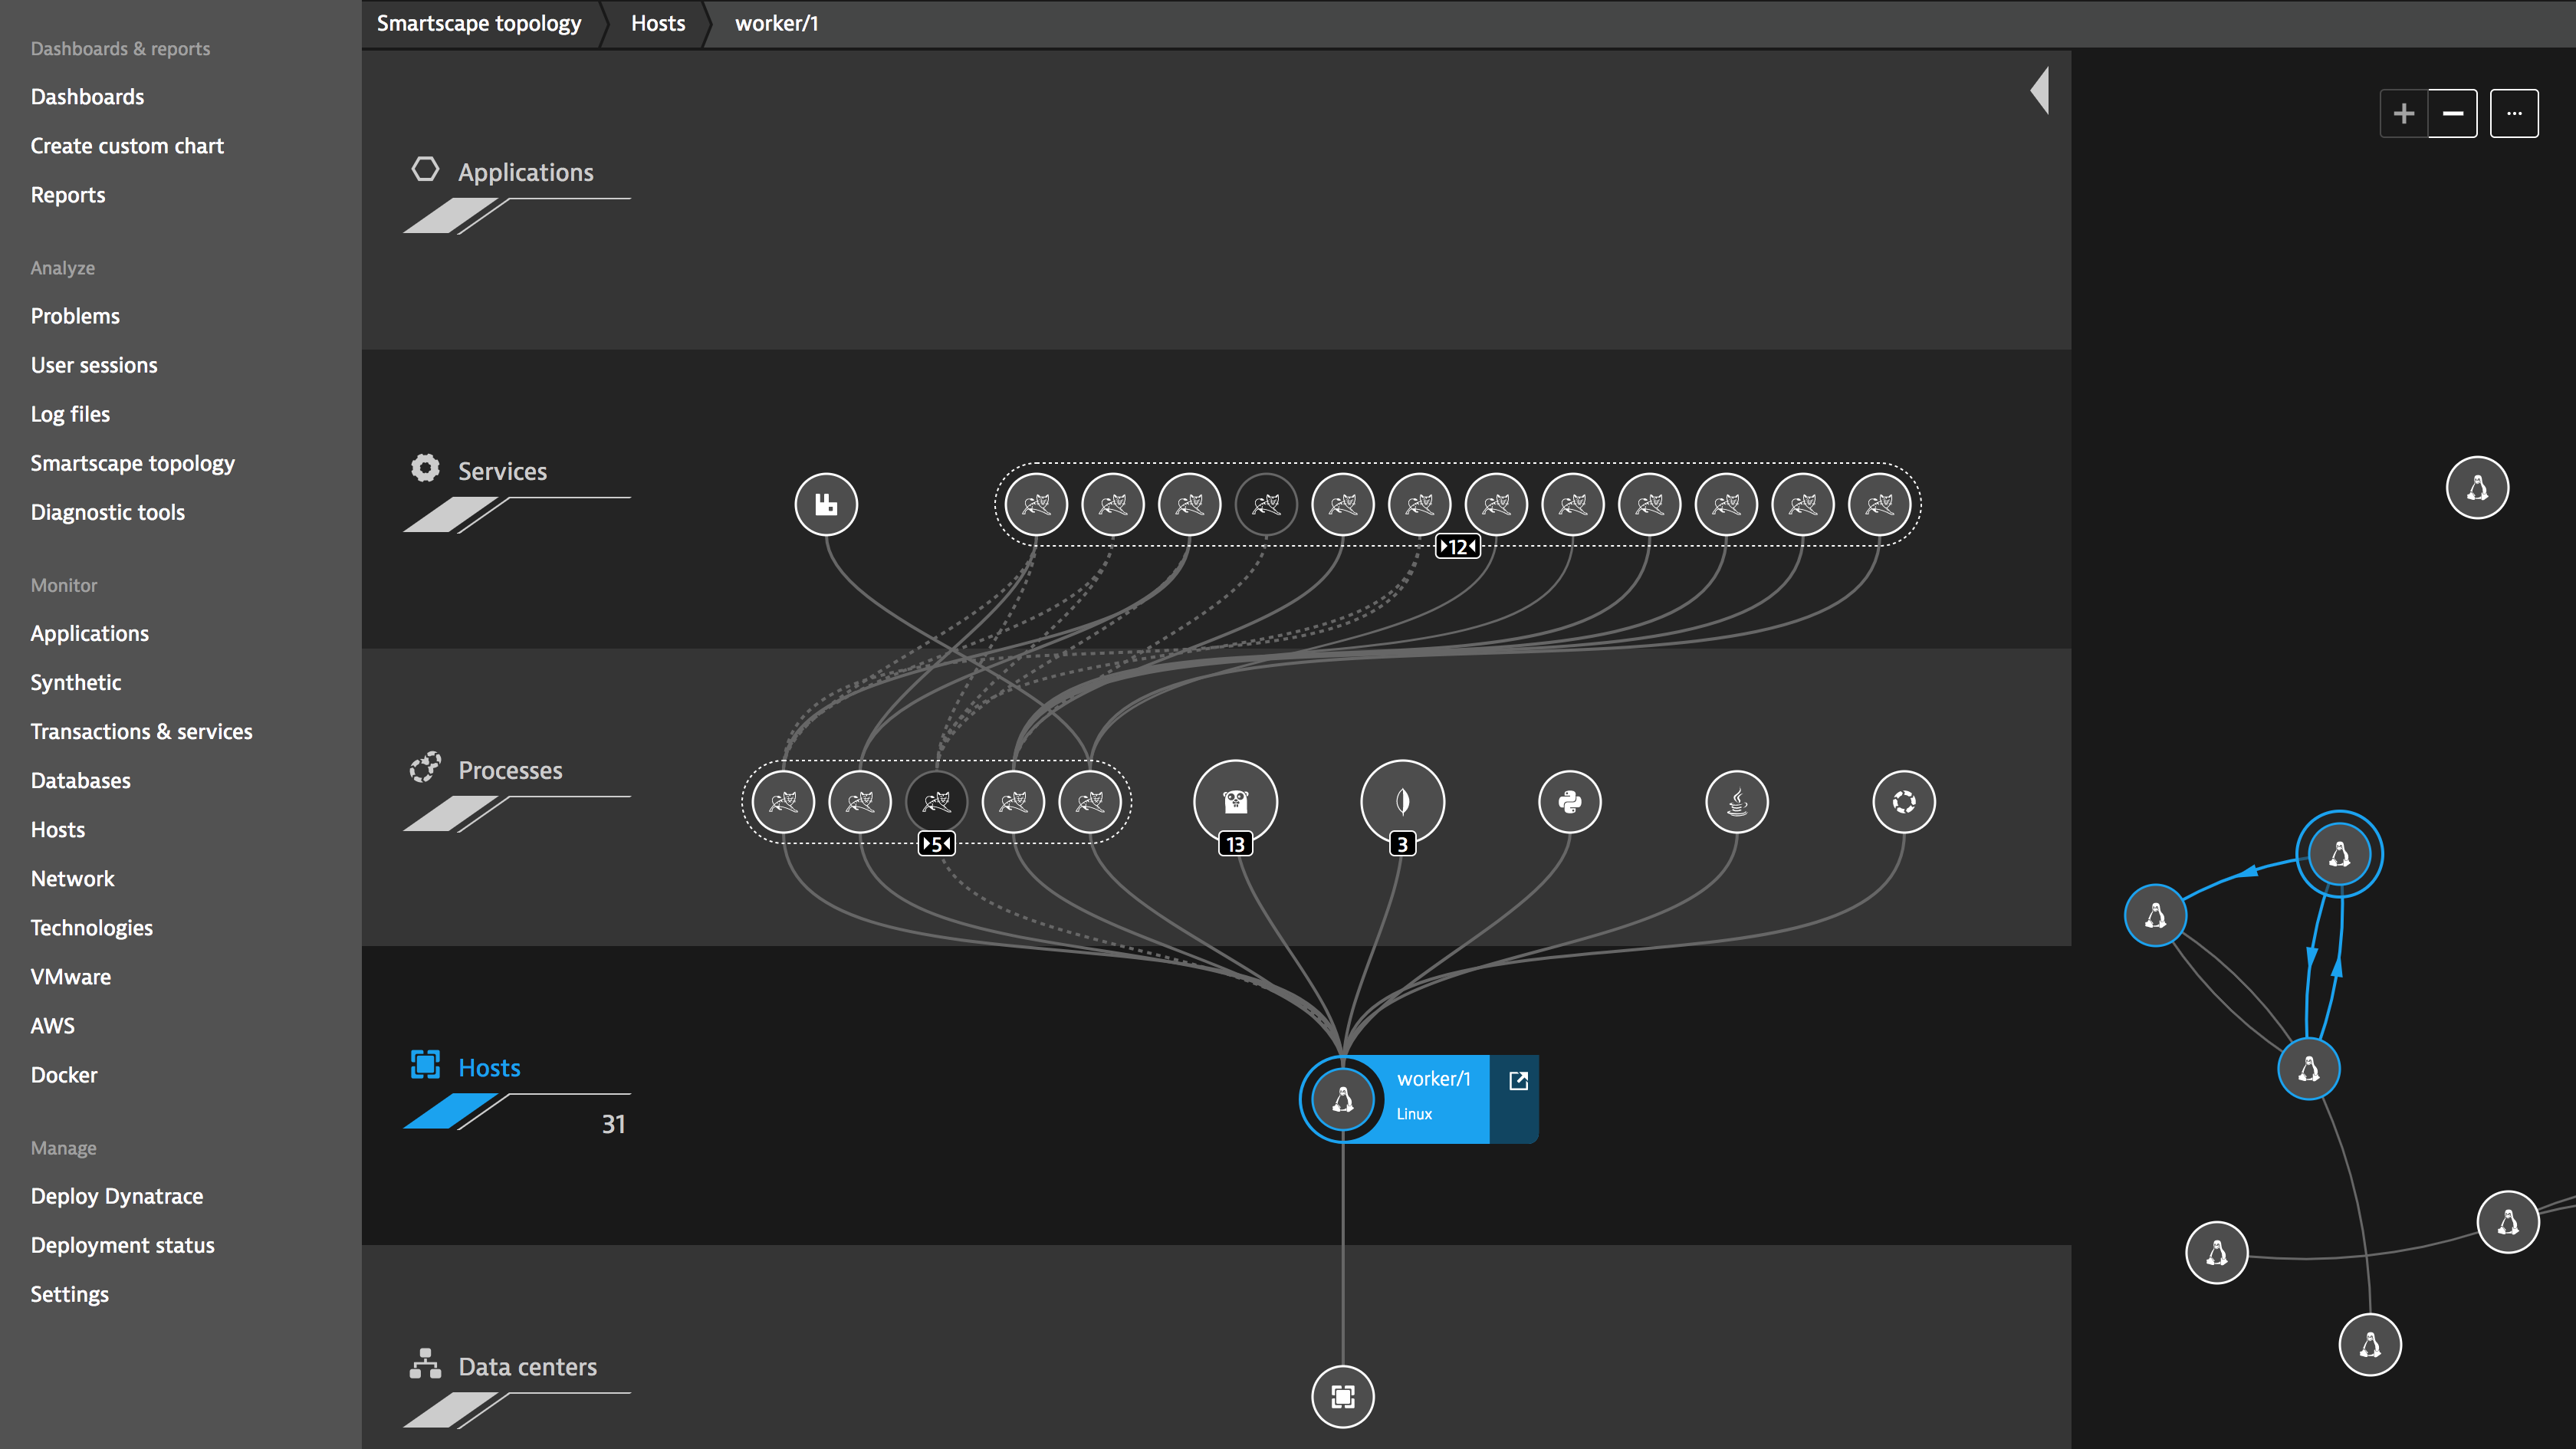
The Kubernetes worker node not only hosts the database and load generator, but also pods from other deployments. In this scenario, we’re also running the well known sock-shop microservices deployment with some Golang, Node.js, and Java-based apps.
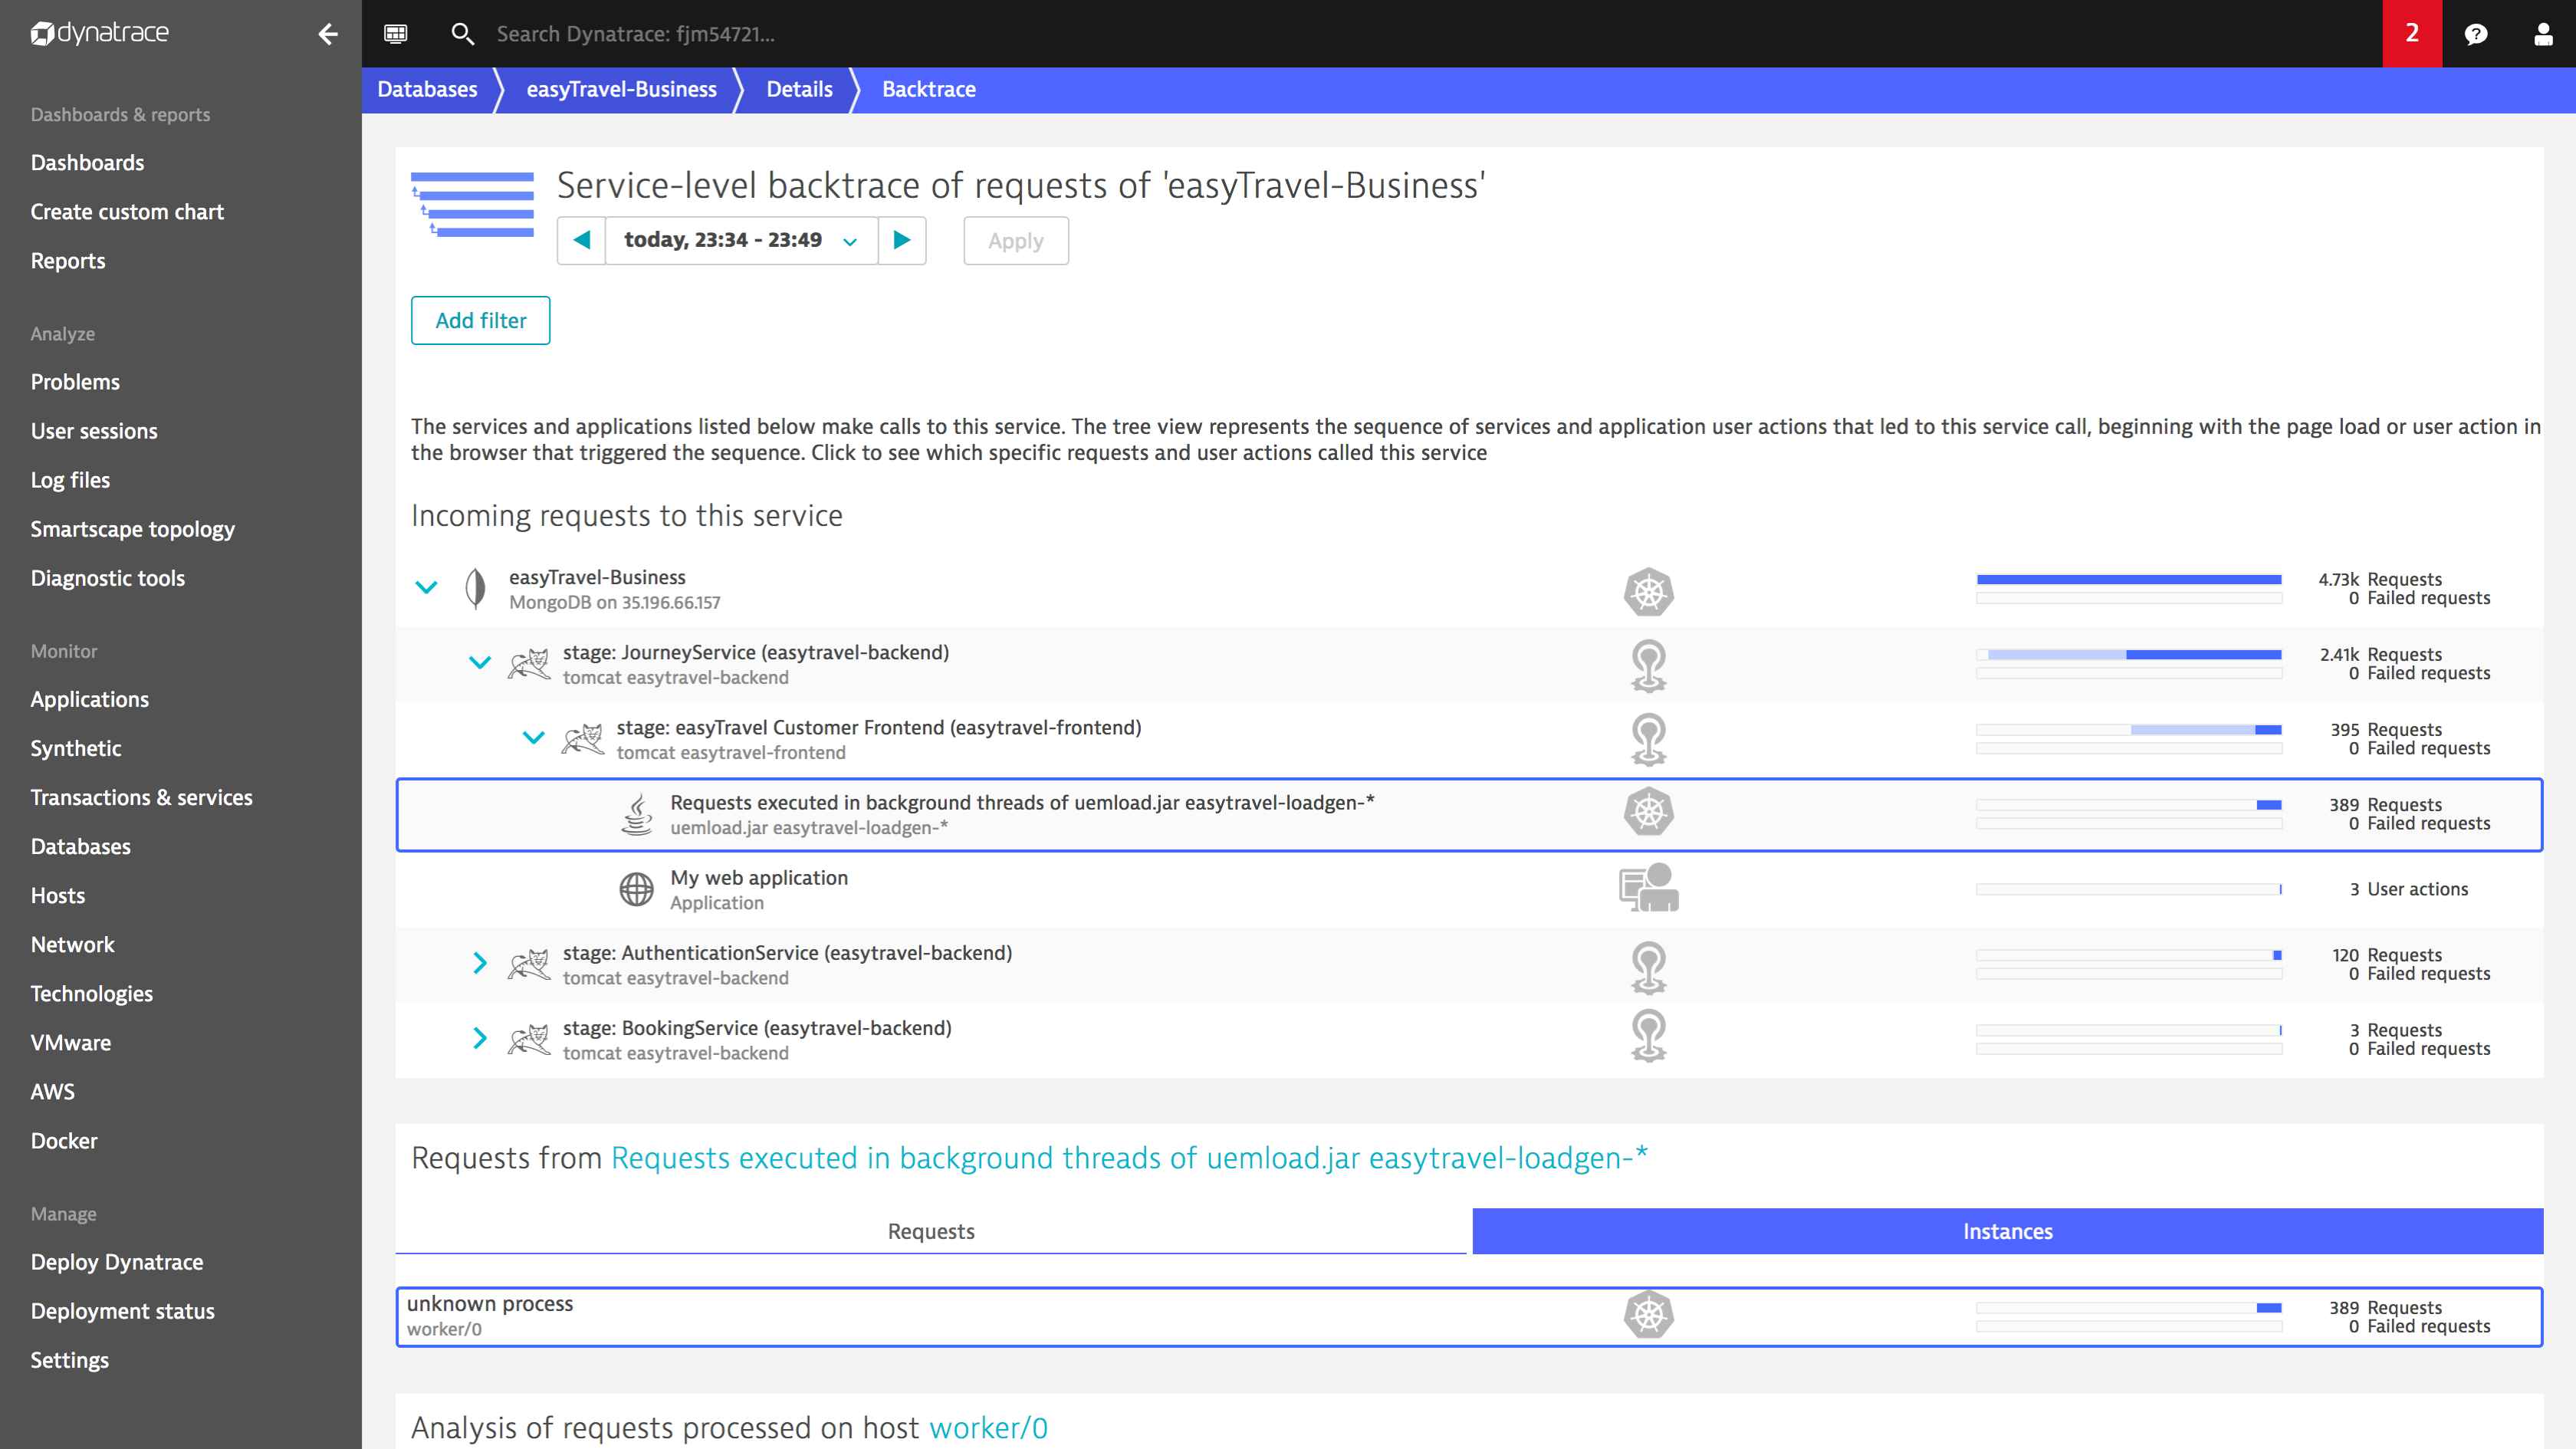
Dynatrace not only provides you with visibility into tracing from microservices to databases, it also works in the opposite direction, so you can analyze callers of certain database services (for example, deployments running in Cloud Foundry that call the database in Kubernetes).
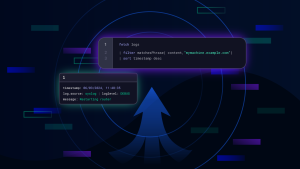
Analyzing exceptions in multi-datacenter environments
Another big advantage of full-stack monitoring within distributed cloud environments is getting insights into undesired behavior and exceptions of applications across platforms and understanding how exceptions may be affecting your microservices.
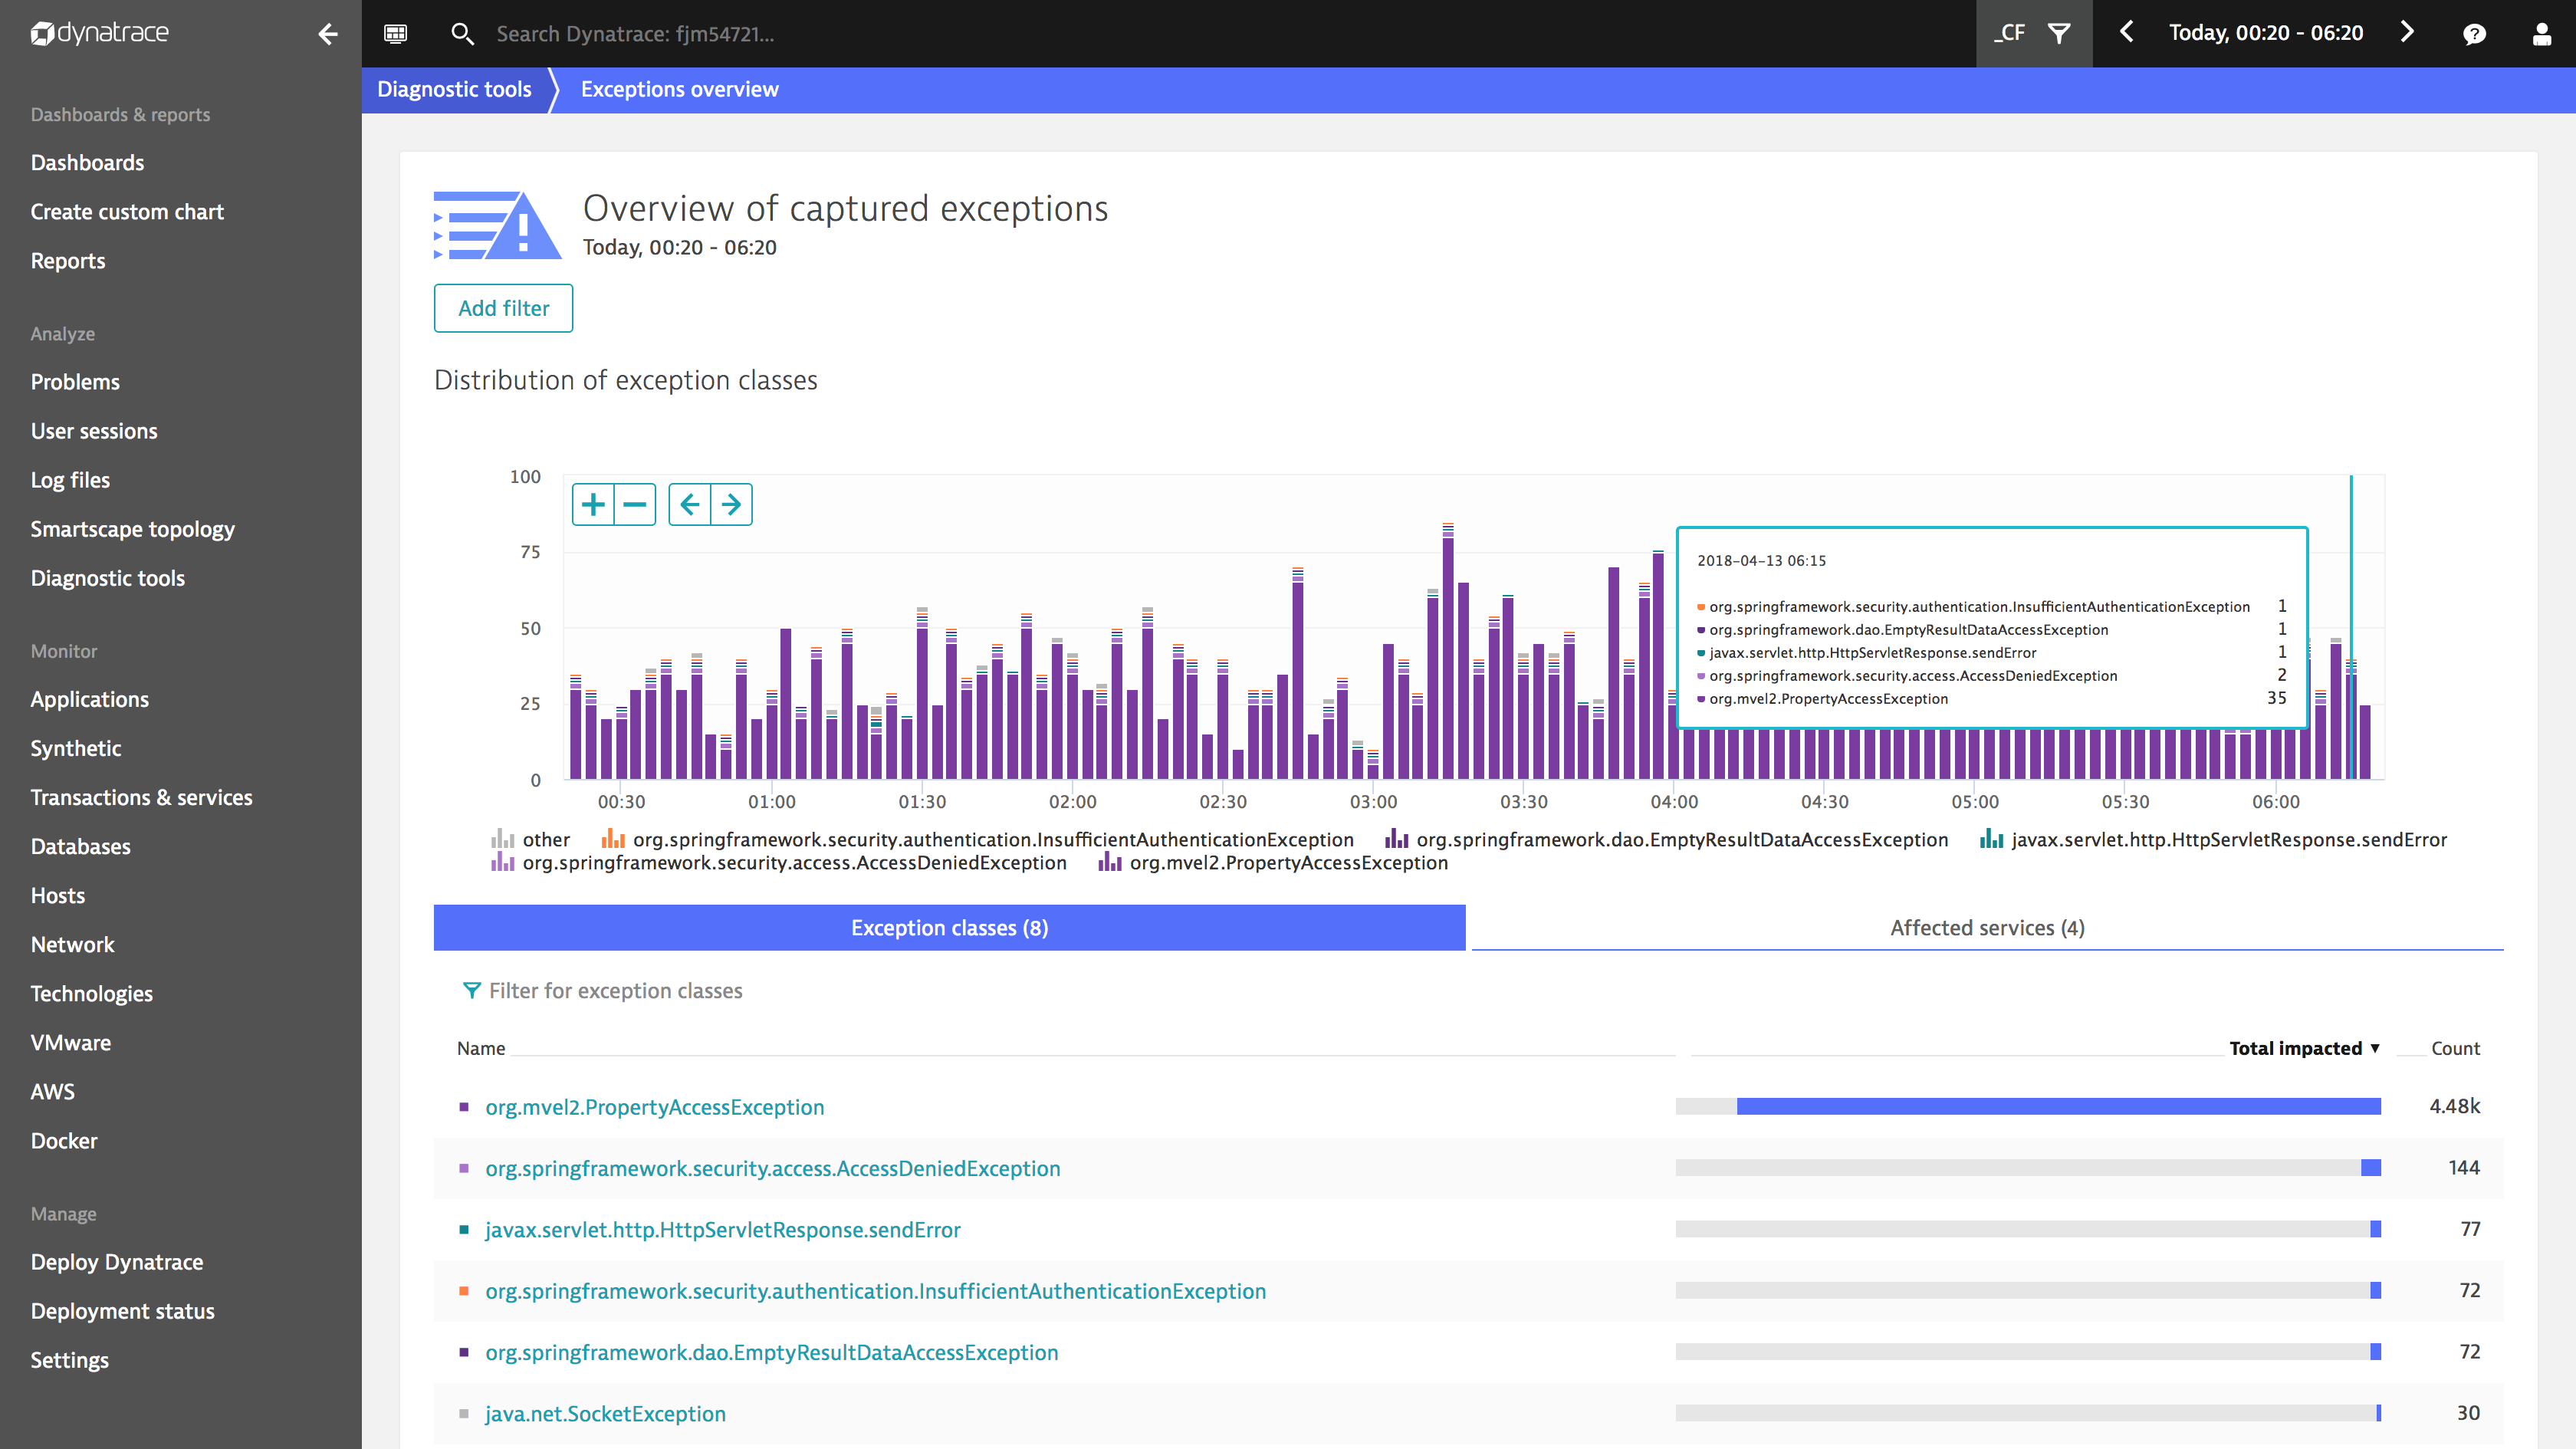
This allows you to drill-down and understand where in your source code specific exceptions were thrown and how they impacted your services. For this, Dynatrace groups together stack traces of exceptions that have similar exception messages. To analyze a single exception, you can drill down even further and view the traced request along with the exception details in the PurePath.
![]()
Leveraging Management Zones
Monitoring all these stacks within a single Dynatrace environment enables you to pinpoint the root-cause of issues within complex multi-platform environments. Management zones are a great tool for managing user-access to the monitoring detail of specific monitored entities (for example, clusters, hosts, and services). In this way, Dynatrace users can be granted varying rights for switching between configurable, partitioned views of your overall environment.
Some of the Management Zones we’ve set up for this example scenario are:
- _Kubernetes: Everything running in Kubernetes, including nodes, services, and applications
- k8s-namespace:easytravel: Applications only running in the Kubernetes namespace `easytravel`
- cf-org:easytravel: Applications only running in the Cloud Foundry production space
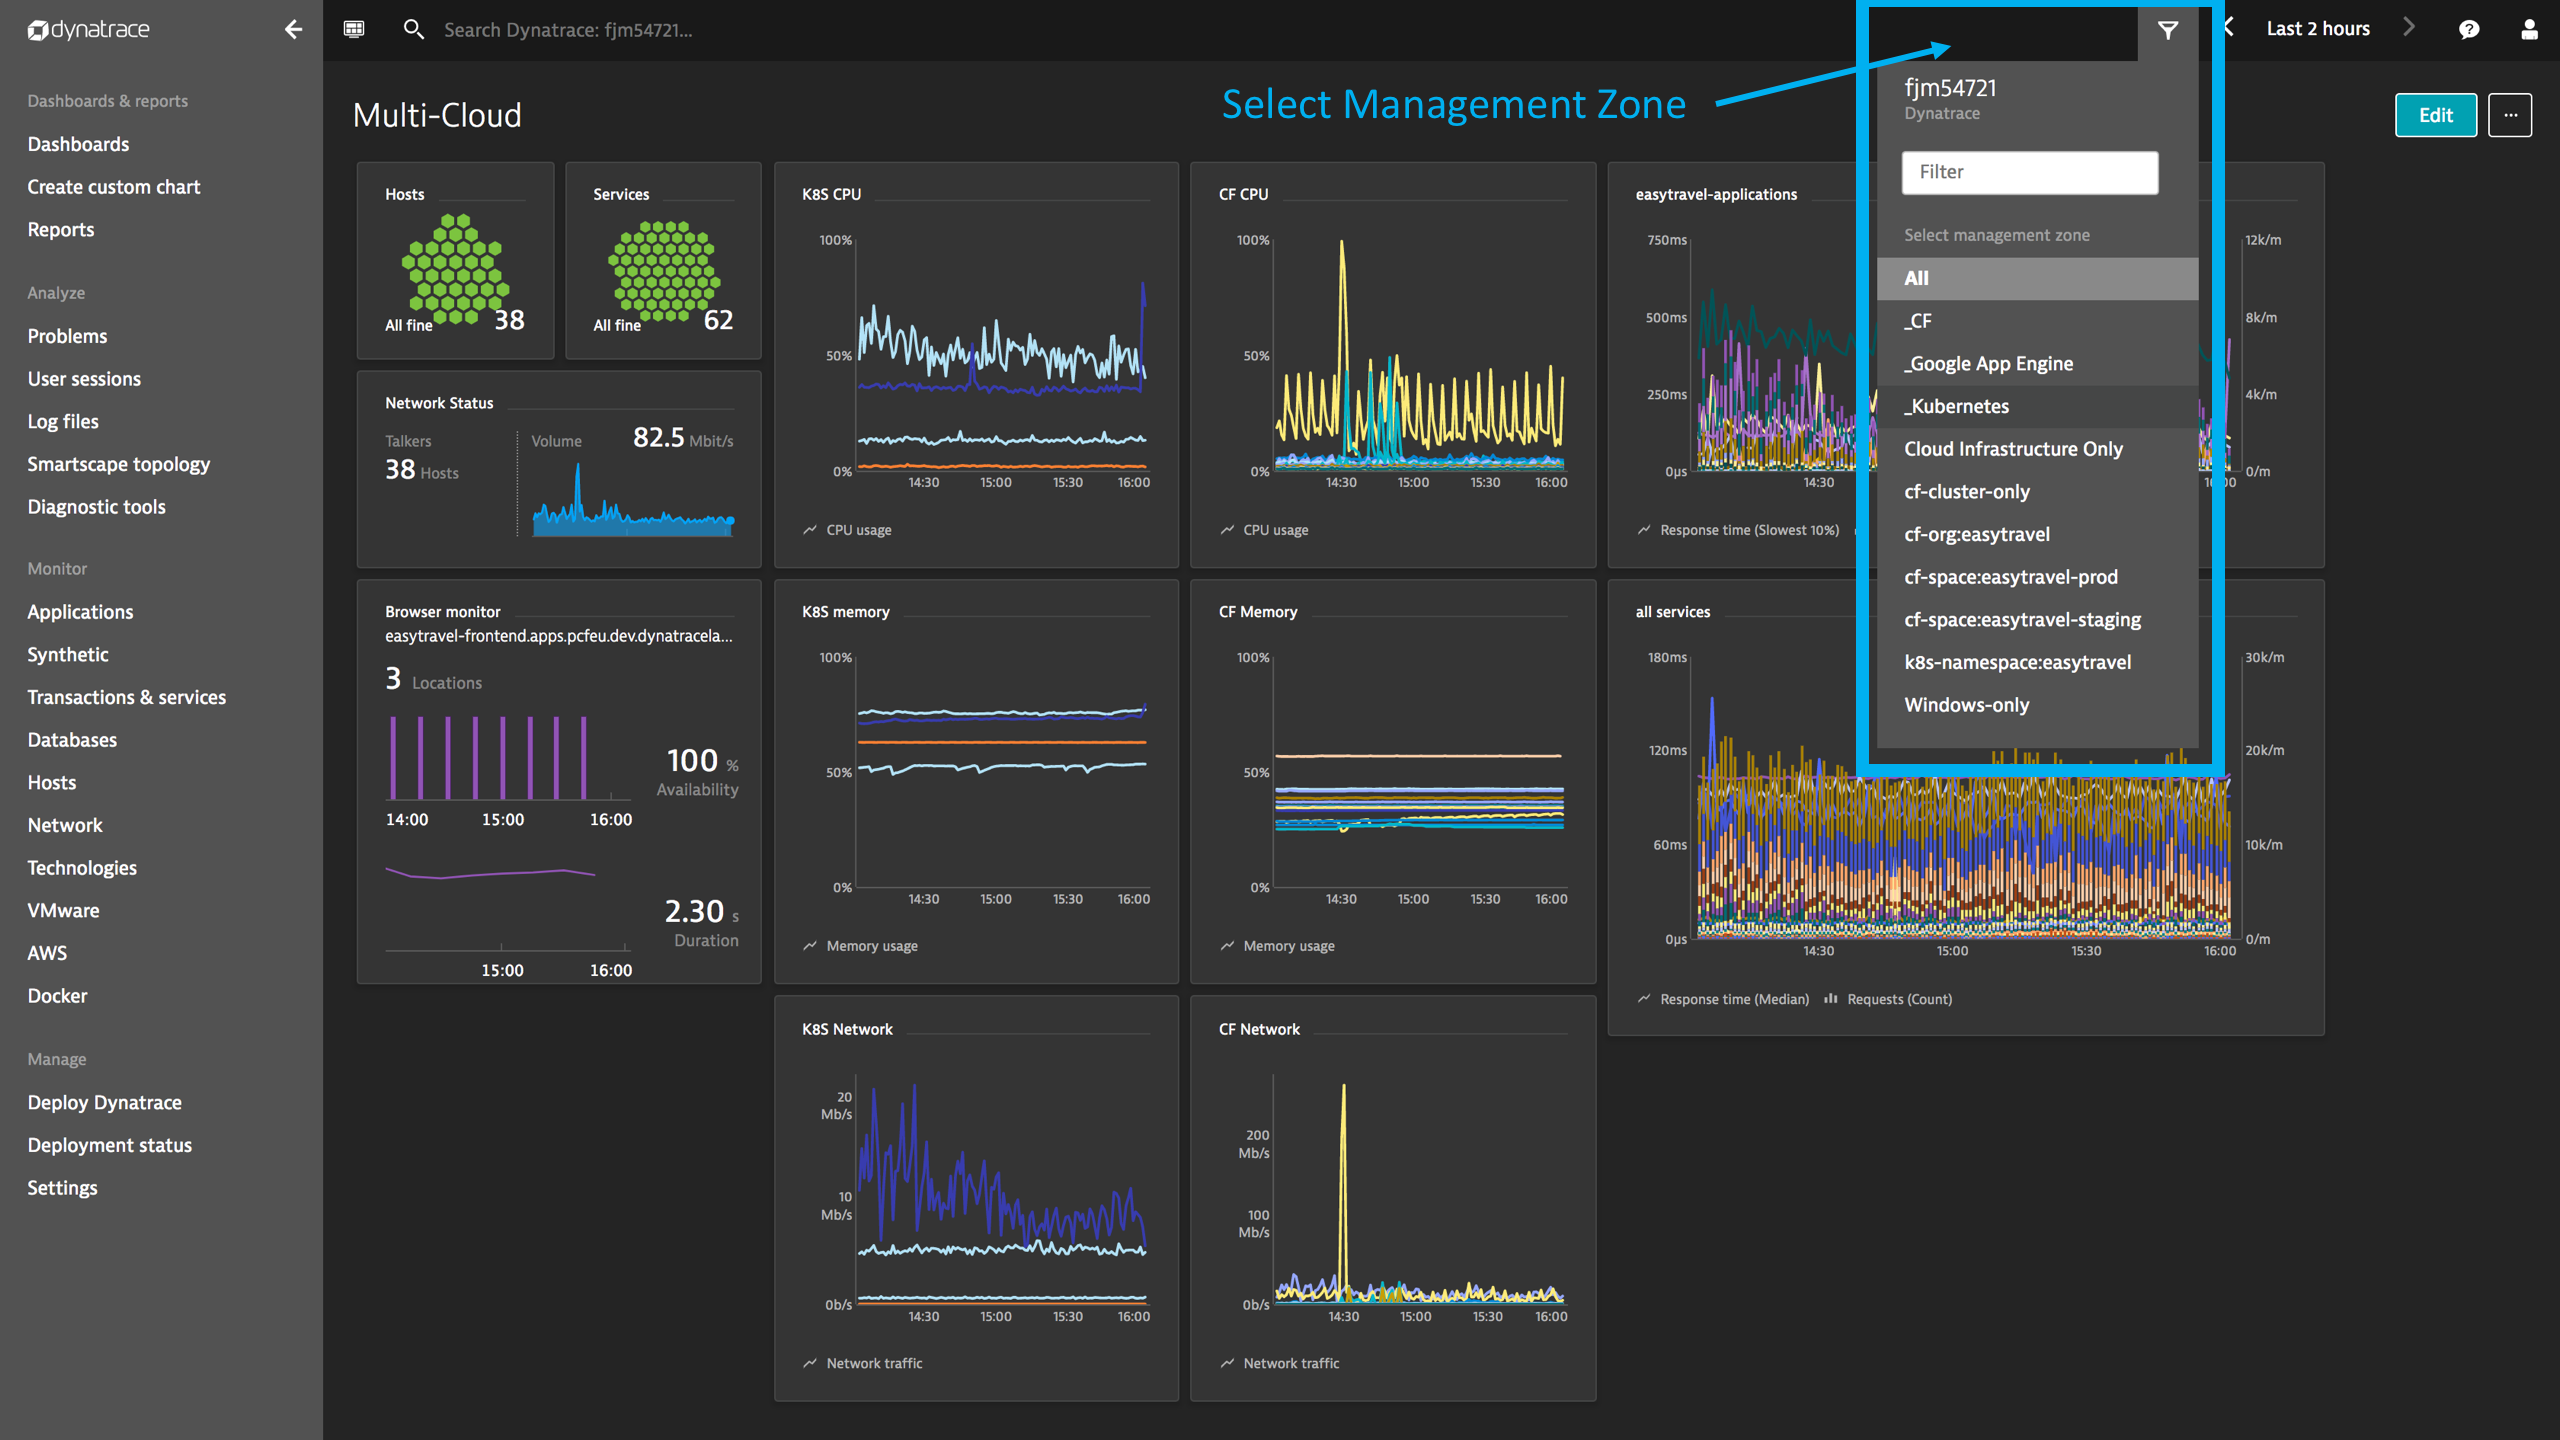
The selected management zone helps users focus on the entities they are interested in without losing the root-cause analytics power and deep monitoring capabilities of Dynatrace.
Tell us more about your environment
What cloud platforms are you using in combination to streamline your organization’s microservices deployments? Let us know how we can help you gain visibility into your own multi-cloud platform environment by posting your comments at Dynatrace Community.
Do you want to gain deep insights into your microservices performance?
Then start your free trial and let Dynatrace monitor all deployed applications and microservices automatically.


Looking for answers?
Start a new discussion or ask for help in our Q&A forum.
Go to forum