
When evaluating the next best-fit monitoring tool for your environment make sure to add MTTI (=Mean Time to Instrumentation) to your list. I don’t think MTTI is an official metric, YET, but MTTI is top of mind of a Dustin, who is currently evaluating the next generation of APM (Application Performance Monitoring) tools for his current employer. Last week after a workshop, I got to chat with Dustin and he filled me in on why this metric is so important for him as somebody responsible for cloud performance monitoring & engineering.
In his life as an Enterprise Performance Engineer, Dustin saw MTTI drop significantly with the 2nd generation wave of APM tools. While that was great, Dustin feels it is not enough for the next generation of applications he and his team are tasked to monitor (cloud platforms, microservices, containers, serverless, …): Dustin needs MTTI to go down to 2 minutes – otherwise he and his team are spending too much time configuring and calibrating their monitoring platform!
I promised to dedicate this blog post to his thoughts and idea about MTTI, about how he defines MTTI and how he quantifies MTTI when evaluating different monitoring vendors.
2nd Gen APM reduced MTTI from two weeks to two hours
As mentioned above, Dustin has seen the evolution of monitoring vendors over the years. Instead of manual code instrumentation, APM vendors leverage dynamic byte code instrumentation during application start. Thanks to recent advances in the application runtimes (Java, .NET, …) and the capabilities of runtime class reloading, it is even possible to change the instrumentation “on the fly” while the app is still running. This makes it much easier to experiment with instrumentation rules and avoids some back and forth with the initial coders. All these benefits are leveraged by 2nd generation APM vendors such as AppDynamics, NewRelic, Dynatrace AppMon and others.
To quote Dustin: “In my experience, 2nd Gen APM reduced MTTI from 2 weeks to about 2 hours!”
Where 2nd Gen APM falls short!
Two hours doesn’t sound bad – does it? Not at all if you have a stable J2EE environment that keeps running on the same JVM and the same OS and you have figured out which APM agent to install and which config file to change to tell your JVM to load that agent. That same holds true for your Apaches, NGINX, IIS, Node.js, Python, Ruby, … based applications. 2nd Gen APMs require you to know A LOT about the application you want to instrument, e.g: exact OS version & bitness, exact version of your runtime, exact location of the config file to set your environment variables or startup parameters. And if you just have one of these things wrong you either don’t see any data and you wonder why or your application doesn’t start anymore, and you also wonder why!
If you have been following my previous performance blogs, you know that the #1 question I received from my AppMon Personal License users was this: I don’t see any data in AppMon even though I followed all your instructions. The two top reasons why it didn’t work for them was:
- They changed the wrong config file and essentially nothing got loaded
- They loaded the wrong version of the agent causing the app not to start correctly
To quote Dustin: “As a user of a monitoring solution I SHOULDN’T’ NEED TO KNOW HOW I monitor all these applications, services and hosts. The monitoring tool has to figure this out automatically!”
Today’s technology stack demands an MTTI of two minutes!
There are different approaches of bringing down MTTI even further, e.g: provide a smart installation script for all supported platforms and runtimes and automate the necessary installation and configuration steps leveraging modern Configuration Management tools such as Chef, Puppet, Ansible or baking the installation of the monitoring agents into your Terraform or CloudFormation templates. The only challenge with this approach is that you must maintain all these scripts yourself if the vendor is not providing you with these scripts and keeps updating them.
Besides installation and configuration, there is another issue that Dustin brought to my attention. He told me that while all the APM vendors that he has used in the past provide great code-level visibility for those transactions that have an obvious performance issue or an obvious error – most of them fall short to provide good enough default instrumentation to understand what causes these issue in case they don’t originate in that one transaction that was slow. He gave me this example: If a single transaction is slow because it must wait for a free socket or free database connection, I get to see that in tool XYZ. What I don’t see is why there are no sockets or connections available. I don’t get to see the code-level instrumentation in those transactions that seem to operate correctly but are the root cause of the issue!
Why is it that most 2nd Gen APMs don’t provide good enough default instrumentation? My personal opinion is that most 2nd Gen APM tools have been built for the Ops Use Case. The goal here was to focus on outlier detection and then provide details for these slow transactions. APM solutions have been architected and optimized for that use case which also kept overhead really low. This approach is totally fine for most traditional operations teams, but becomes an issue for real DevOps teams, SRE teams or teams that try to become more proactive when it comes to analyzing issues. Why? Because the level of instrumentation details required to understand what is really going on is not available. I believe that 2nd Gen APM tools haven’t been able to solve this problem because adding more default instrumentation would automatically lead to more overhead which is not what you want in a large scale production environment!
To get more data, the teams must go back and add more custom instrumentation points. While this is not that hard to do, it has two big downfalls:
- Constant re-adding of custom instrumentation adds up: both on manual labor and monitoring overhead
- The whole idea of monitoring is to get all your data as the problem happens. Why add more instrumentation and wait until the problem happens again?
My last quote from Dustin on that subject is: “I need a solution that doesn’t force me to add more custom instrumentation after the fact. This impacts my MTTI and eventually prevents me from fully automating monitoring into our new Cloud Delivery Pipeline. I need MTTI to be at 2 minutes!”
Dynatrace OneAgent, Smartscape, PurePath and AI deliver the MTTI you need!
I can’t tell you how other vendors are addressing all these concerns that Dustin raised. What I can tell you, is how we address it at Dynatrace. At Dynatrace, we have learned from our own 2nd Gen APM product called AppMon. While it is an amazing product that delivers high fidelity end-to-end tracing and performance data, it falls short when it comes to rolling it out to large scale environments with a high degree of technology diversity.
Therefore, we invested in the 3rd Gen approach of monitoring, which addresses the shortcomings mentioned above but also addresses the new challenges that we have seen introduced with Cloud Technology Stacks such as Microservices, Containers, Serverless, “opinionated” PaaS, …
Here are the things we have built for you – delivering the MTTI you need for today’s and tomorrow’s technology stacks!
Dynatrace OneAgent: One install, Zero configuration!
Dynatrace OneAgent comes as a single installer for Linux, Windows, AIX and Solaris. You take this installer and roll it out whenever you start a new physical, virtual or cloud instance of an OS. The agent is fully configured and knows where to send data to without requiring any additional configuration.
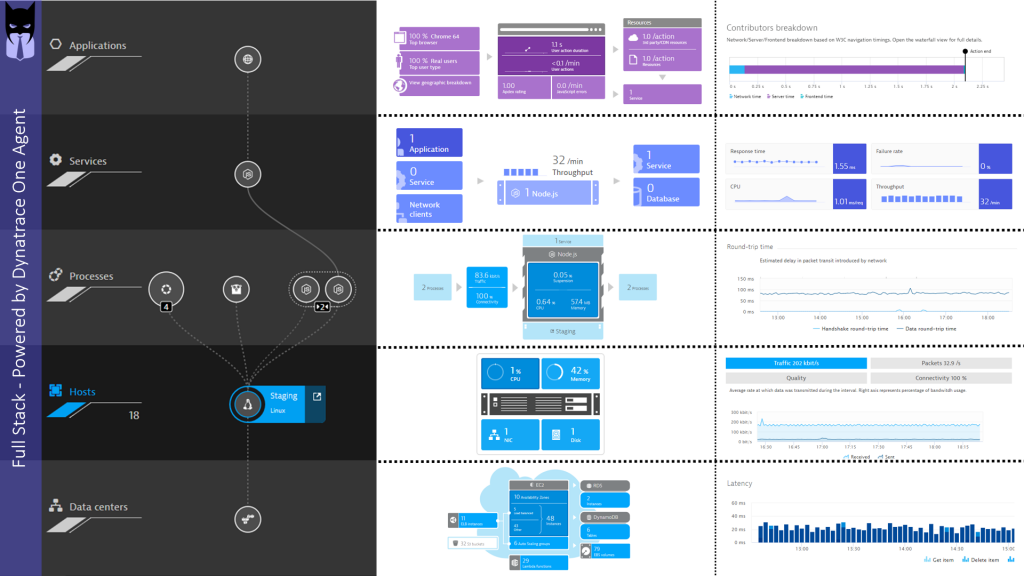
Once installed, OneAgent automatically detects and monitors your hosts, log files, processes, containers, cloud services, applications and end users. No configuration is required, as the OneAgent automatically injects itself into your application runtimes (JVMs, CLRs, Node.js, …) or web servers (Apache, NGINX, IIS …) based on the detected version and platform. The OneAgent also detects your containers and automatically instruments the processes running WITHIN the containers, fully supporting orchestration platforms such as k8s (Kubernetes), ECS or PaaS platforms such as OpenShift, CloudFoundry or AWS Beanstalk. Once installed the OneAgent gives you Full-Stack visibility: From Data Center all the way up to your Applications and End Users:
As we have a bi-weekly update schedule for our SaaS customers and a 4-week cycle for our Managed (=On-Premises) customers, we make sure that our agents always understand the latest versions of frameworks or platforms. If you move ahead with the latest version of Node.js, .NET Core or you try the latest service from AWS, Azure, Google or Red Hat you can be sure that our OneAgent already knows how to automatically monitor it. No need to spend time with custom instrumentation which would impact you MTTI!
We also have 10+ years experience in building very lightweight instrumentation which allows us to simply capture more data out-of-the-box as compared to other vendors. If you want to learn more about the OneAgent, then hear it yourself from our Chief Software Architect Helmut Spiegl, who recorded the following YouTube Tutorial with me explaining: “3 Secret Sauces of Dynatrace OneAgent”
Dynatrace Smartscape: FullStack dependency information
While 2nd Gen APM was focused on individual applications, Dynatrace focuses on Full-Stack monitoring which includes every single TCP/IP connection between every host and every process, every socket, service and database connection between your and 3rd party services and every dependency of your applications with your backend and 3rd party services. This dependency information that is captured LIVE is called Smartscape. And while we provide a nice visualization of all these dependencies in our web interface, the power really comes to play in other use cases:
- Feeds the Dynatrace AI for real root cause analysis
- Feeds external systems with LIVE CMDB information, e.g: ServiceNow
- Enables automated architecture validation during Continuous Delivery
- Enables implementation and validation of auto-scaling and self-healing
If you want to learn more about what you can do with Smartscape, check out some of my video tutorials on my YouTube Channel: Dynatrace Full-Stack Performance Clinics!
Dynatrace PurePath: Proven instrumentation-based end-to-end tracing!
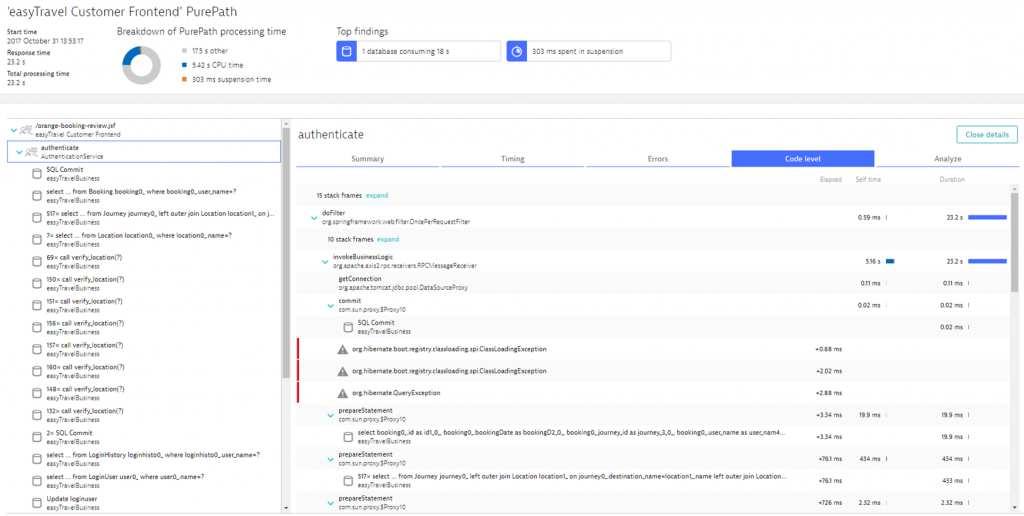
I started to work at Dynatrace on April 1st 2008 – that’s more than 10 years ago. And back then, the one thing that sold me was Dynatrace’s PurePath technology, which provided the best out-of-the-box, end-to-end tracing for Java & .NET based applications. The engineering team has since evolved PurePath and made it available on all the other major technologies we see in the market. It can scale to hundreds of thousands of runtimes and containers and it provides an out-of-the-box instrumentation depth that eliminates custom instrumentation to capture more root cause information:
The PurePath updates are identical to the OneAgent experience. As PurePath gets traced by the technology specific part of the OneAgent each update we push out to our SaaS & Managed customers will make sure that the latest version updates of popular frameworks, runtimes or services get correctly instrumented. You don’t have to spend extra time fixing any missing instrumentation. We take care of that!
Dynatrace AI: Better through Better Data & Context
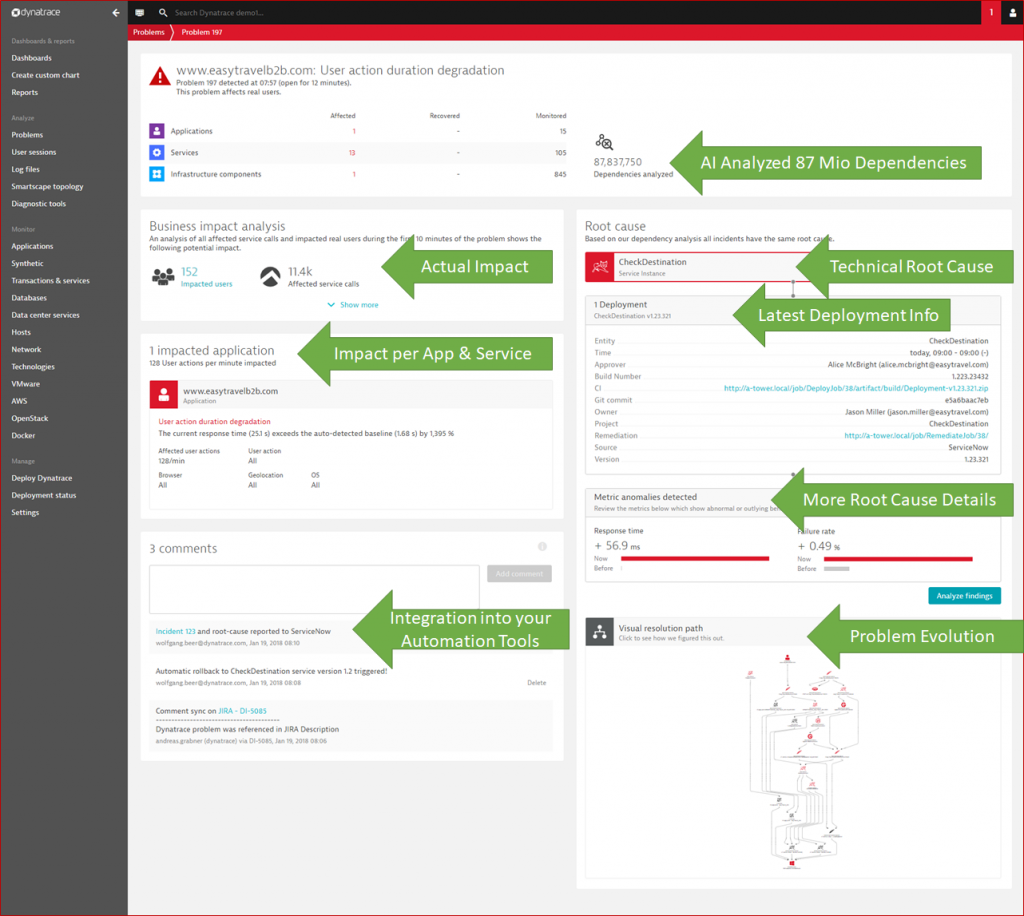
I recently gave a presentation and also wrote a blog about “Dynatrace AI Demystified” – if you want to learn more about the internals of our AI, have a look. The Dynatrace AI leverages all data from Dynatrace OneAgent, Smartscape and PurePath and therefore allows us to scale monitoring from a couple of Java-based application servers to hundreds of thousands of containers or functions that either run in your own data center, on top of a PaaS or in the public cloud. We have built the AI to also understand changes in your environment, any configuration changes you execute, or any deployment done out of your Continuous Delivery Pipeline. And once the AI detects an issue, we present the actual impact, root cause and all related events in a single Dynatrace Problem as shown in the following screenshot:
While all this data is presented in the UI, the more important aspect is that handling problem information can be fully automated. We provide several out-of-the-box integrations with your incident management, configuration management, self-healing or collaboration tools.
Faster MTTI also speeds up monitoring adoption!
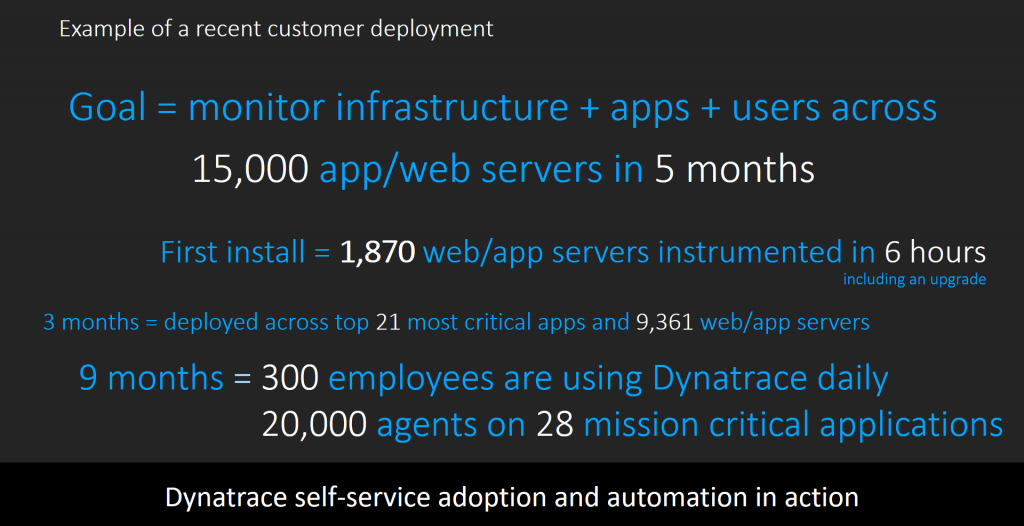
In a recent Performance Clinic I hosted, my colleague Kristof Renders, gave a great overview of the differences between 2nd Gen and 3rd Gen monitoring and how 3rd Gen solves the problems of modern application architectures. He also gave some examples on how OneAgent, Smartscape and AI has not only reduced MTTI but really sped up adoption of Dynatrace. If you want to learn more, watch the full webinar on YouTube. One of the highlights was this adoption success story:
Reduce your MTTI: Start Today!
Thanks again to Dustin for our inspiring conversation we had in Denver. Thanks for allowing me to take your idea of MTTI and write this blog. I hope I did your idea justice and you like the outcome!
For those that want to see how Dynatrace changes MTTI in your environment as compared to what you have right now, feel free to either sign up for our Dynatrace SaaS Trial.


Looking for answers?
Start a new discussion or ask for help in our Q&A forum.
Go to forum