
At Dynatrace, we have AI-detected Problems, which are opened when Dynatrace detects anomalies with your applications (impacting end users), services (impacting service levels) or infrastructure (unhealthy system components). Because of Dynatrace’s full-stack monitoring approach, the Dynatrace AI can rely on Smartscape which represents the live dependency graph of all your hosts, processes, services, applications, deployments and logs, as well as your Cloud or PaaS environments. Instead of raising multiple alerts for individual events, e.g: a full disk on a host, a slowdown of a micro service and the resulting slow page load time for your end users, the Dynatrace AI simply opens a single problem ticket that contains all relevant events of all related entities based on your live dependency model. The following shows such a Dynatrace Problem ticket!
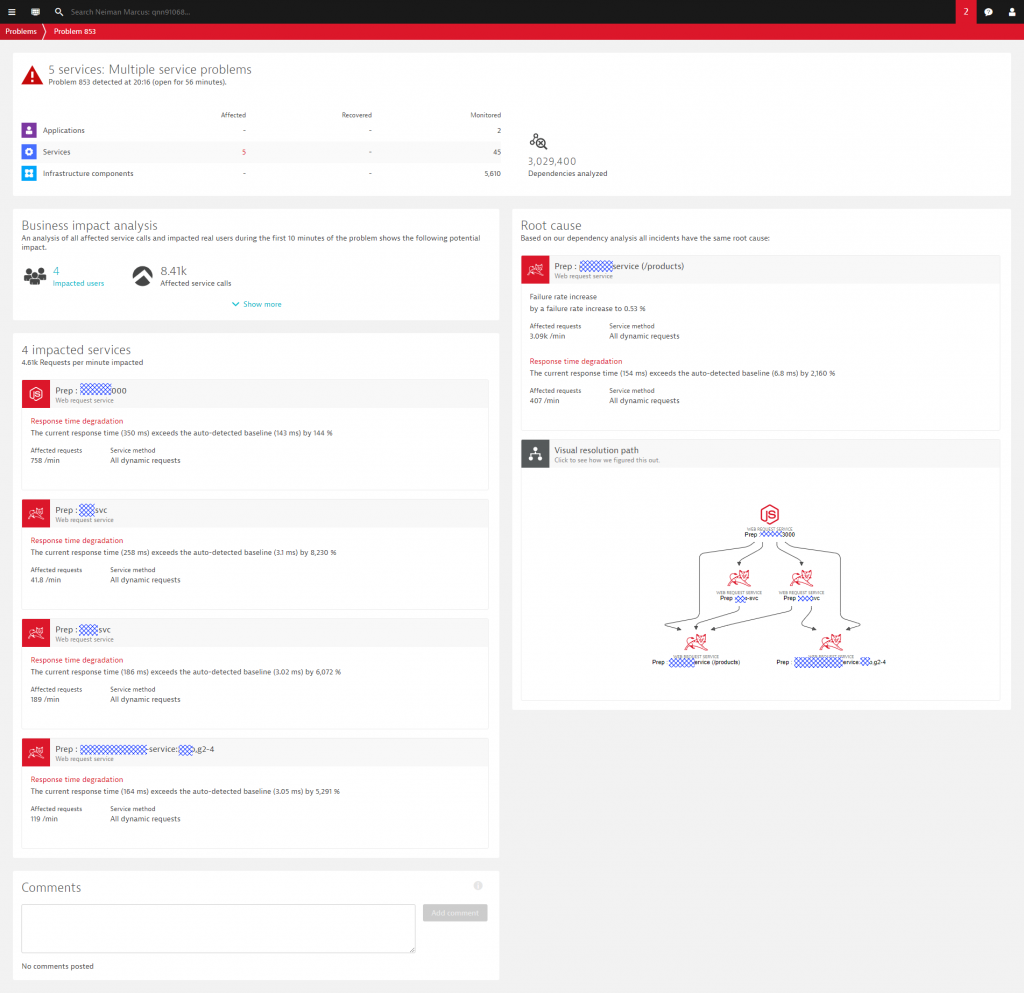
In addition to all observed events (critical logs, deployment events, performance issues, resource issues, …) and analyzed dependencies, Dynatrace also highlights the extent of the business impact, e.g: how many end users or how many service calls are impacted by this problem. If you want to learn more about the internals of the Dynatrace OneAgent, Dynatrace Smartscape, the multi-dimensional baselining and the AI-supported Problem Detection, check out some of my recent blog posts on Dynatrace AI in action: Dynatrace AI In Action December 2017, Dynatrace AI for RabbitMQ, Cassandra and JVM Memory or Dynatrace AI Detecting Rogue Python Script.
Every time Dynatrace detects a new problem or detects that a problem has been resolved, it allows us to forward that information to:
- Incident management tools such as ServiceNow, PagerDuty, xMatters, VictorOps, OpsGenie
- Collaboration tools such as Slack, JIRA …
- Auto-remediation platforms such as Ansible Tower, StackStorm, SNOW, …
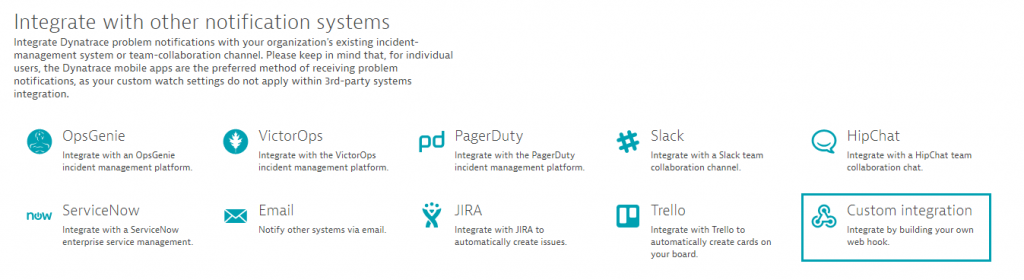
To configure these integrations in your own environment simply go to Settings -> Integration -> Problem notifications in your Dynatrace Tenant. Should be straight forward!
Building your own Custom Integration
While Dynatrace comes with several out-of-the-box integrations, many of our users want to integrate their own custom tools with Dynatrace AI-detected problems. For integrating any type of external tool, Dynatrace offers a Custom Integration option where Dynatrace can call any custom webhook every time a new problem is detected or when the status of an existing problem changes.
The following screenshot shows how to configure a Custom Integration, what options are available to customize the HTTP POST Payload and when Dynatrace should call that webhook (Alerting profiles). The payload can be any type of textual format but a JSON object is suggested – especially because some of the placeholders will render themselves as JSON objects and JSON arrays:
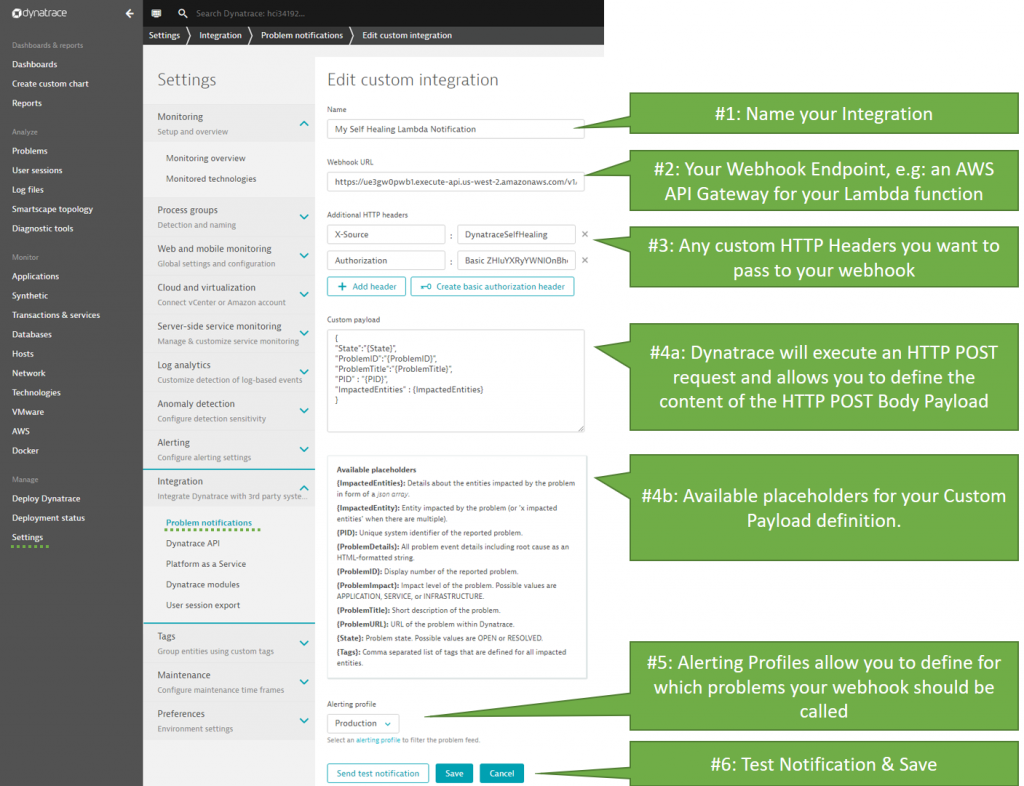
The settings for your custom integration should be self-explanatory – but – let me give you a bit more detail on the individual settings as highlighted in the screenshot above:
#1: Every integration configuration needs a logical name. Any name is good here!
#2: This is the webhook endpoint: If you are using Dynatrace SaaS make sure this URI is accessible from the public internet as Dynatrace SaaS by default runs in the public cloud. If you run Dynatrace Managed (=On Premise), make sure that this URI is accessible from your Dynatrace Managed server
#3: Custom HTTP Headers can be used to pass additional authentication headers or any other custom HTTP Header to your webhook. A custom HTTP Header – as shown in the image above – is a good way to protect your public webhook from being called from unknown sources by making sure a certain token is passed. In my example I use “X-Source” and the Authentication header. This is optional – but – I think a “good practice”
#4a: This is where you define your HTTP POST Payload. This is a free form text field with the options of placeholders that are explained in the next info box. Remember: this is the HTTP POST Body that will be passed to your webhook. Just make sure that your webhook implementation can process it!
#4b: Most placeholders will be replaced with a simple string. Therefore, make sure that you put the placeholder under quotes (“{placeholder}”) in case you want to use them as JSON property values. Otherwise you may end up with invalid JSON that gets posted to your webhook. The only exception is {ImpactedEntities}. This placeholder will be rendered as a JSON Array, e.g: [“entity123”, “entity234”]
#5: Specify for which types of problems you want this integration to be invoked. Alerting profiles are a very flexible option to define what you really want to pass to your integration. Soon we will also have Management Zones as an additional way to organizes your notification integrations based on your organizational structure, application responsibilities, …
#6: Once everything is configured you must test your integration successfully before you can save it!
A reference implementation using AWS Lambda
As part of my Unbreakable Pipeline Tutorial, I implemented an AWS Lambda function that handles Dynatrace Custom Problem Notifications. The screenshot above is in fact calling that Lambda function that is exposed via an AWS API Gateway to the outside world!
That Lambda function – implemented in Node.js (find source code on GitHub) – analyzes the list of impacted entities as detected by Dynatrace. Thanks to the Dynatrace REST API my Lambda function can query additional information about the Problem (through the Problem API), any previous deployment or configuration change events (through the Events API) as well as timeseries data (through the Timeseries API) such as change in incoming load or load distribution in a service cluster. Depending on all the evidence the Lambda function can trigger remediating actions.
I kept my “Self-Healing” example very simple: In case any of the impacted services got a new version deployed within the last 30 minutes (that timeframe is configurable), I let my Lambda function execute a rollback to the previous version. The deployment information about the previous deployed version itself was pushed by my Continuous Delivery Pipeline during the last deployment. That Deployment Event contains all relevant information I need for a rollback, e.g: Deployed Version, Deployment Automation Script, … The following shows the overall workflow:
- Deployment details from AWS CodePipeline gets pushed to Dynatrace via Events API
- Dynatrace AI detects a problem and triggers my Lambda based on the Custom Integration
- Lambda function pulls additional information from Dynatrace via Problem and Events API
- Lambda function re-deploys previous version
- Lambda function posts a comment back to the Dynatrace Problem ticket via Problem API
Tips and Tricks for your own Custom Integration
When I implemented this Lambda function, I took a couple of notes and wanted to share them as Best Practice or Tips & Tricks with you, in case you go on and build your own integration. Hope you find this useful – if you come up with any of your own Tips & Tricks let me know!
#1: Responding to Send Test Notification
Before you can save your Custom Notification Integration, you first have to click on “Send test notification”. This allows Dynatrace to validate whether your configured endpoint is correctly handling that HTTP POST.
To understand what information gets passed to my webhook I logged the relevant HTTP POST Request data when clicking on “Send test notification”. Below is a snapshot of that log output. You can see that there is a lot of evidence on WHO is calling our webhook (User-Agent, X-dynaTrace, X-Source …) as well as evidence in the HTTP POST Payload as it contains some dummy/test data. This should make it easy for you to differentiate between a “real” notification and a “test” notification:
{
  "httpMethod" : "POST",
  "headers" : {
    "Accept": "*/*",
    "Accept-Encoding": "gzip,deflate",
    "Authorization": "Basic ZHluYXRyYWNlOnBhc3N3b3Jk",
    "Content-Type": "application/json",
    "X-dynaTrace":"FW1;149.........",
    "User-Agent": "ruxit server",
    "X-Source": "DynatraceSelfHealing"
  },
  "body" : "{\n\"State\":\"OPEN\",\n\"ProblemID\":\"TESTID\",\n\"ProblemTitle\":\"Dynatrace problem notification test run\",\n\"ImpactedEntities\" : [{ \"type\" : \"HOST\", \"name\" : \"MyHost1\", \"entity\" : \"HOST-XXXXXXXXXXXXX\" }, { \"type\" : \"SERVICE\", \"name\" : \"MyService1\", \"entity\" : \"SERVICE-XXXXXXXXXXXXX\" }]\n}"
}}
Dynatrace either expects you to return an HTTP 200 Status Code to signal everything is correct, or an error code such as HTTP 400 in case there are any problems, e.g: your webhook expects certain data in the Payload that is not there.
My Lambda function expects the PID as well as the list of ImpactedEntities to be part of that JSON payload. If these JSON properties are not present I respond with HTTP 400 and give a textual explanation about the missing field. In case all mandatory fields are present I check whether the payload includes the text XXXXXXX. Seems like this is one way to validate that this is just a Test Notification which means I have nothing else to do than returning HTTP 200. Another option to identify this call as a Test Call is to validate whether ProblemID equals “TestID” or whether the ProblemTitle field is “Dynatrace problem notification test run”.
Here is my source code snippet showing all the input data validation my Lambda function does. Full source code is available on GitHub:
 var response = {
        statusCode: 400,
        headers: { "content-type" : "text/html" },
        body: ""
    };

    if(!event.body || !event.body.startsWith("{")) {
        response.body = "Method expects a Dynatrace Problem Notification Lambda
Object in the Post Body";
        callback(null, response);
        return;
    }

    // Let’s parse the JSON object make sure we have the mandatory fields
    var notificationObject = JSON.parse(event.body);
    if(!notificationObject.PID) {
        response.body = "Missing PID";
        callback(null, response);
        return;
    }

    if(!notificationObject.ImpactedEntities) {
        response.body = "Missing ImpactedEntities";
        callback(null, response);
        return;
    }

    // this indicates a Dynatrace Test Message - we just return that everything is OK
    if(event.body.includes("XXXXXXXXXXXXX")) {
        response.statusCode = 200;
        callback(null, response);
        return;
    }
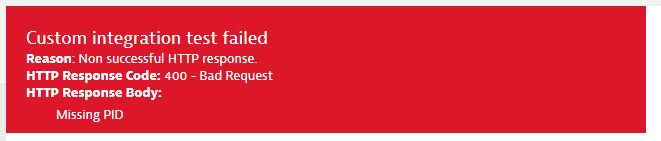
When executing a “Send test notification” and I DO NOT pass the mandatory PID or ImpactedEntities field in the payload definition, I get to see my error response in the Dynatrace web interface:
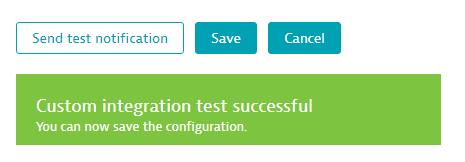
If all mandatory data is present, you will see a green notification box and you can now save the configuration:
#2: Pull in additional Problem Event Details
The Dynatrace Problem API allows you to query additional information about the Problem itself, e.g: a full list of impacted entities (in case you haven’t passed that as part of the initial payload definition), all events that the Dynatrace AI correlated to that problem, all tags from the related entities that are part of that problem, …
To query additional data through the Dynatrace Problem API you need to have the PID. The PID is the unique Problem ID that uniquely identifies a problem in your Dynatrace Tenant. In my example I made PID a mandatory input field – I suggest you do the same.
Attention: DO NOT confuse PID with ProblemID. ProblemID is the human readable ID of the Problem that you also see in the Dynatrace UI, e.g: Problem 235. The PID is a longer numeric value!
Tip for Auto-Mitigation / Self-Healing: If you are building your Custom Notification Integrations for smart auto-remediation or self-healing I suggest you query the problem details and focus on the rankedEvents. The rankedEvents is a list of all anomalies Dynatrace observed in all entities related to this problem. It’s the same details you see when you open the Problem evolution view in the Dynatrace UI. This list is also constantly updated with additional events Dynatrace correlates while the Problem is still in OPEN state. Depending on your Auto-Remediation approach and tooling you might want to keep pulling problem details and check for additional evidence. This allows you to build even smarter remediation actions. For more ideas on self-healing check out my blog on Smart Auto-Remediation and Self-Healing.
#3: Post Comments back to Dynatrace Problem
If your Custom Notification Integration executes any action(s) based on the problem details I suggest you let Dynatrace know about your action(s). The best way to do this is to use the Dynatrace Problem API which allows you to push a comment back on that problem ticket. This is a great way to keep an audit trail of all activities triggered by a Dynatrace AI detected problem. Whether you are simply forwarding the problem details to a chat, sending an email or executing remediating actions. In any of these cases it is good practices to also post this action as a comment back to the problem. Anyone who will be looking at that problem – either through the Dynatrace UI or through the REST API – can immediately see who has worked on that problem already.
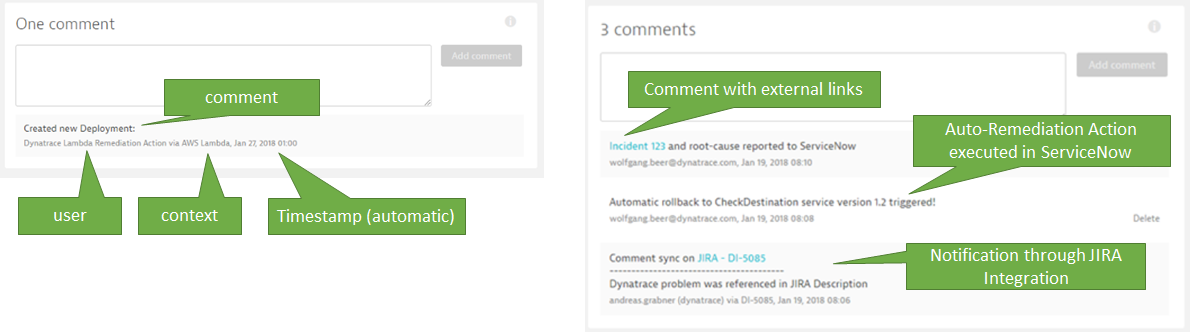
The following is the code snippet of my Lambda function that posts a comment back to the problem ticket. You can see that Dynatrace expects 3 pieces of information for a comment:
- comment: the comment text itself. Can also contain links, e.g: Here is my comment, [click here for more details](https://external link)
- user: either a username, email or some type of identification or who posted this comment
- context: this should refer to the tool/external service that posted that comment
Here is the source code snippet – full code can be found on GitHub:
// post codedeployresult back to Dynatrace Problem
var commentBody = {
  comment: fixedEvent.CodeDeployResponse,
  user: "Dynatrace Lambda Remediation Action",
  context: "AWS Lambda"
}

var fullUrl = dtApiUtils.getDtTenantUrl() + "/api/v1/problem/details/" +
notificationObject.PID + "/comments";
dtApiUtils.dtApiPost(fullUrl, dtApiUtils.getDtApiToken(), commentBody, function(statusCode, data) {
  console.log("Push Comment to Dynatrace: " + fullUrl + " " + statusCode + "-" + data);
});
Once comments are posted they will show up on the problems overview screen. The following shows a couple of examples:
#4: Lifecycle of a Problem
Dynatrace opens a problem when the AI detects an anomaly based on dynamic baseline violations or when static thresholds are violated. The problem will remain open until the actual impact, e.g: High Response Time, High Failure Rate, Low Disk, … is resolved. While the problem remains open, Dynatrace keeps collecting more evidence about the nature of the problem and how the problem evolves through your system. As of today – April 2018 – Dynatrace only calls the notification integrations when a problem gets opened or closed. This may change in the future with additional status changes, e.g: new events correlated, comment made, …
If you want to react on changes through its “Problem Evolution”, my best practice advice is to keep pulling Problem Details through the Dynatrace Problem API for that PID. This requires more than just a simply webhook that reacts to a Problem Open event, e.g: it would require a script or scheduled background job that keeps polling more information of currently open problems. Good news is that there is a Problem API call that gives you the list of current open or closed problems regardless whether you have a specific unique PID. Keep that option in mind when implementing your tools on top of the Dynatrace Problem API.
Go Build Your Own! I have a template implementation for you to start!
You should now know everything it takes to write your own Custom Problem Notification handler. You also have the background on my AWS Lambda function and the complete source code.
Additionally, I thought to give you one more AWS intendant code template implementation so that you don’t have to create something new from scratch. I wrote a sample Node.js application without any special dependencies that handles incoming requests from Dynatrace Problem Notification. The source code and instructions on how to run and connect that template can be found on the following GitHub page: Dynatrace Problem Notification Reference. The template supports all the key best practices and use cases as explained above:
- Validate Input Headers
- Validate Mandatory Input JSON Fields
- Handle Test Notification Call
- Pull full Problem Details through Problem REST API
- Push a Comment back to the Problem via Problem REST API
Now there is NO EXCUSE any more to NOT start writing your own implementation. I really made it easy for you to start 😊 – what I ask from you is to keep me posted in case you write your own integration!
Start a free trial!
Dynatrace is free to use for 15 days! The trial stops automatically, no credit card is required. Just enter your email address, choose your cloud location and install our agent.


Looking for answers?
Start a new discussion or ask for help in our Q&A forum.
Go to forum