
Ruby on Rails is a free and open-source framework written in the Ruby programming language. It employs the MVC architecture, where ‘M’ stands for Model, ‘V’ stands for View, and ‘C’ stands for Controller.
Before we begin, here’s an interesting fact about Ruby on Rails. Ruby on Rails is made up of two components: Ruby and Rails. Ruby is an object-oriented programming language, whereas Rails is a web framework—a collection of code libraries and data structures that provide generic functionality that can be used as-is, overridden, or further specialized and changed.
Furthermore, the FusionCharts JavaScript charting library includes a plethora of standard and domain-specific charts, widgets, and maps.
In this post, we’ll give you an overview of the FusionCharts Ruby on Rails wrapper, which combines the capabilities of the FusionCharts and the Ruby on Rails frameworks to create interactive, data charts, as well as how to set up charts with Ruby on Rails on web applications. Let’s get started!
 If you see any errors in your code or have trouble executing, click here to download the complete source code of the sample project we have created for this tutorial.
Table of Contents
Part 1: Including Dependencies
To render FusionCharts using Ruby on Rails, we need to include the following: Ruby: RubyInstaller gives everything we need to set up a full Ruby development environment on Windows. We will use RubyInstaller to download Ruby 2.3.3. RubyDevKit: We need to install a suitable RubyDevKit for the above-mentioned version of Ruby. Click here and scroll down to find the links for downloading the development kit. When you execute the file, it’ll ask you for a destination for the files. Enter a pathname with no spaces in it. Click Extract and wait until the process is finished. Next, you need to initialize the DevKit and bind it to the Ruby installation. To do this, open the command prompt and navigate to the folder you extracted the DevKit into. Initialize it by using the following command:ruby dk.rb init
After this, install the DevKit, binding it to the Ruby installation, using the following command:
ruby dk.rb install
RubyGems: RubyGems is a package manager. A package manager keeps track of the software that is installed on your computer and allows you to quickly install new software, upgrade existing software to newer versions, or remove software that you previously installed. Since RubyGems is included in the RubyInstaller, it is automatically installed when Ruby is installed.
Ruby on Rails: We will now install Ruby on Rails using RubyGems. . Type the following command on the command prompt:
gem install rails --version 5.0.0 --no-rdoc --no-ri
In the above command, we’ve said explicitly that we want Ruby on Rails installed without installing RDOC and RI. RDOC and RI, by default a part of the Ruby on Rails installation, are documentation for Rails. However, we are not going to be using this documentation and, that is why it will make no sense to have them unnecessarily clog up disk space.
MySQL: We will first download the software (MySQL Installer for Windows) from the MySQL website and use the installer to install it on our machine.
Next, we’ll set up a MySQL password. By default, MySQL won’t have a password set up, but we’ll need one to protect our data.
MySQL gem: After installing the MySQL software and setting up a password, we’ll install the MySQL RubyGem. It contains the code that allows Ruby to communicate with the MySQL server. Visit this link and you will find that mysql2 is the most popular gem for communicating with the MySQL server. Install this gem by executing the following command at the command prompt:
gem install mysql2
Server: By default, it uses the Puma server.
Part 2: Creating and Configuring the Project
Step 1: Create the Project
Using the command prompt, navigate to your desired directory and use the following command to create a project that uses MySQL as the database.rails new name_of_project -d mysql
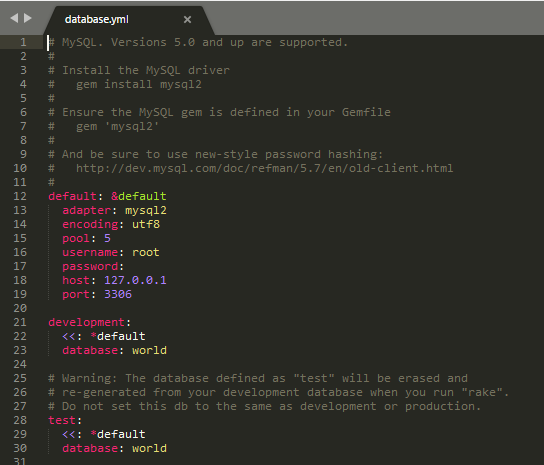
After creating the project, use any text editor and edit the config/database.yml file to connect it to the required database. For the sample chart, we’ll be creating as part of this tutorial, we’ll name our database, as the world. Now, if you refer to the image below, you’ll see that we have set the database name to ‘world’.
Step 3: Launch the Project
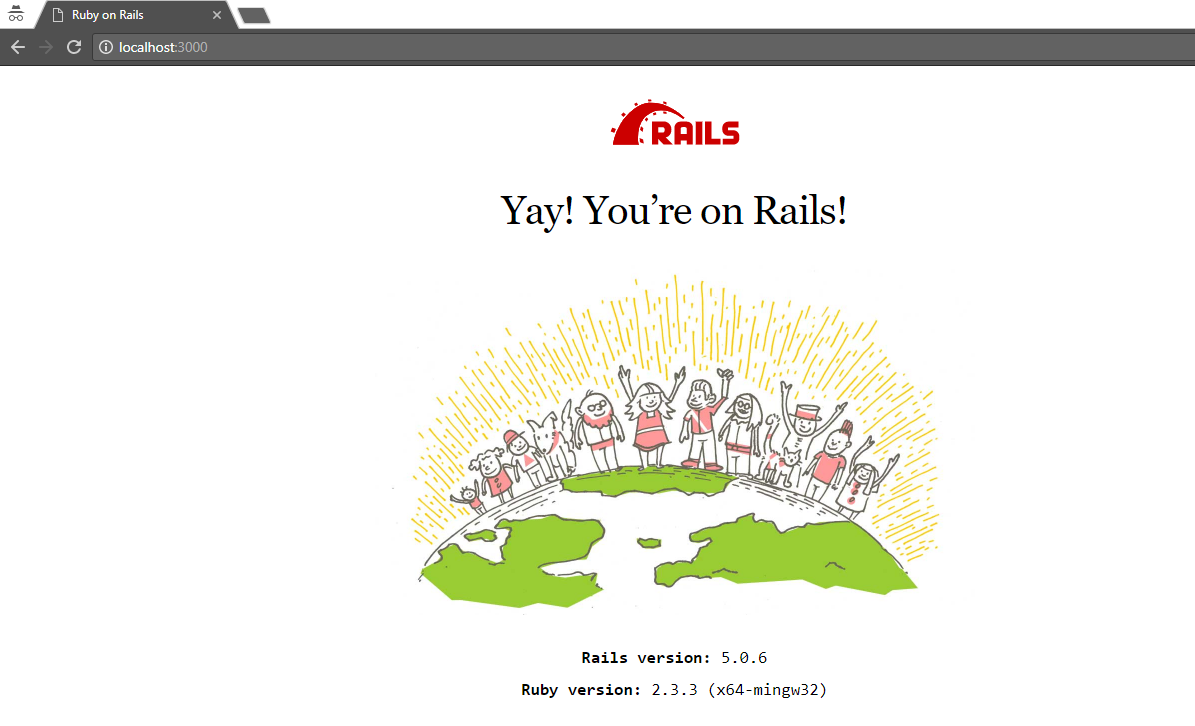
If all the steps have been followed and executed as instructed, we are now ready to run the puma server by executing the following command from the command prompt:rails serve
After running the server, go to the URL (e.g. http://localhost:3000) shown in the command prompt. It will render a home page, as shown in the image below:
Step 4: Install the FusionCharts Ruby on Rails Gem
You can install the gem directly from the command line prompt. To do this, use the command given below:$gem install fusioncharts-rails
Step 5: Include the FusionCharts Library
Download the latest version of FusionCharts library. Once you have downloaded and extracted the files from the package, copy the JavaScript files in thevendor/assets/javascripts/fusioncharts/ folder and add the following code lines in the app/assets/javascripts/application.js file:
//= require fusioncharts/fusioncharts
//= require fusioncharts/fusioncharts.charts
//= require fusioncharts/themes/fusioncharts.theme.fint
Part 3: Generating the Controller and the View
Step 1: Generate the Controller and the View
Use the following command to generate the controller and the view:rails generate controller controller_name viewPage_name
Step 2: Create the Chart
The controller file includes a default method,def <viewPage_name>, having the same name as the view page. This method connects the controller and the view. For our sample, because our view page is named index.html.erb, our method will be called def index. Copy the following code and paste it in the def index method:
@chart = Fusioncharts::Chart.new({
:height => 400,
:width => 600,
:id => 'chart',
:type => 'MSColumn2D',
:renderAt => 'chart-container',
:dataSource => '{
"chart": {
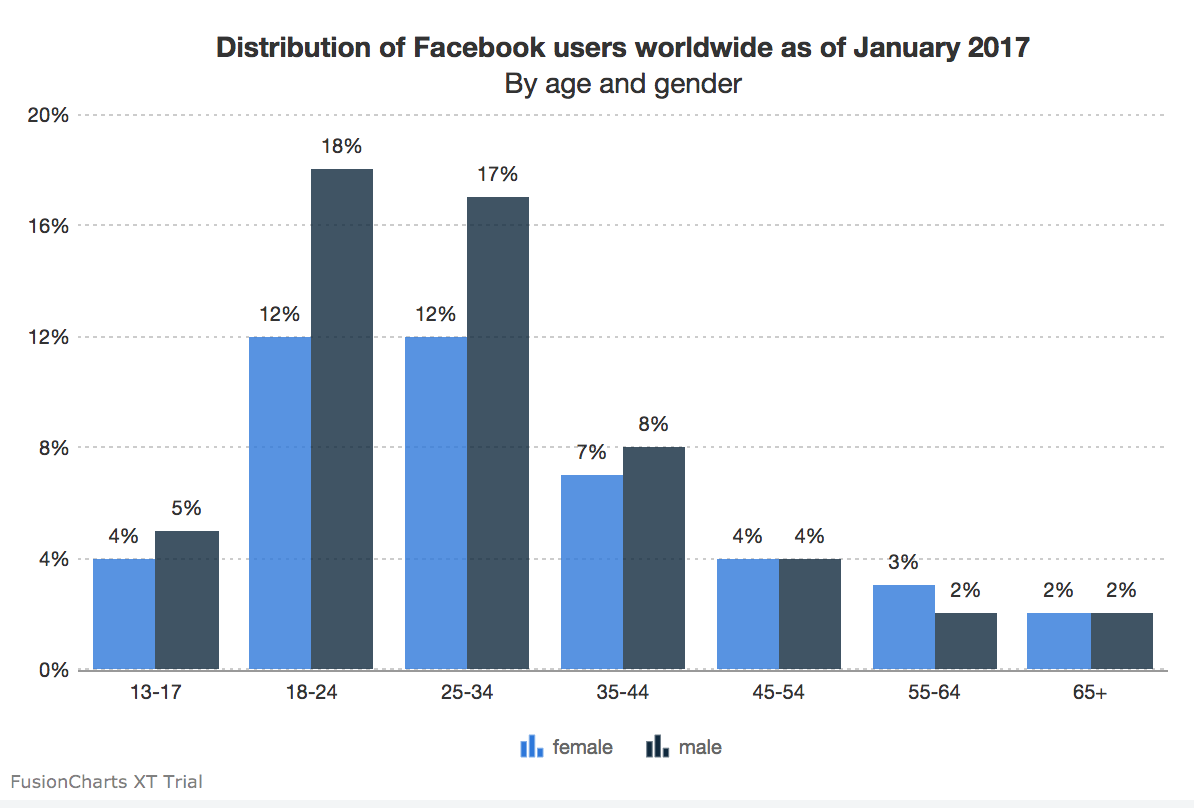
"caption": "Distribution of Facebook users worldwide as of January 2017",
"subcaption": "By age and gender",
"paletteColors": "#2876DD,#0F283E",
"decimals": "0",
"numbersuffix": "%",
"placevaluesinside": "0",
"rotatevalues": "0",
"divlinealpha": "50",
"plotfillalpha": "80",
"drawCrossLine": "1",
"crossLineColor": "#F3F5F6",
"crossLineAlpha": "80",
"toolTipBgColor":"#ffffff",
"toolTipColor":"#000000",
"theme": "fint"
},
"categories": [{
"category": [{
"label": "13-17"
},
{
"label": "18-24"
},
{
"label": "25-34"
},
{
"label": "35-44"
},
{
"label": "45-54"
},
{
"label": "55-64"
},
{
"label": "65+"
}
]
}],
"dataset": [{
"seriesname": "female",
"data": [{
"value": "4"
},
{
"value": "12"
},
{
"value": "12"
},
{
"value": "7"
},
{
"value": "4"
},
{
"value": "3"
},
{
"value": "2"
}
]
},
{
"seriesname": "male",
"data": [{
"value": "5"
},
{
"value": "18"
},
{
"value": "17"
},
{
"value": "8"
},
{
"value": "4"
},
{
"value": "2"
},
{
"value": "2"
}
]
}
]
}'
})
The above code contains the chart attributes, that add aesthetics to the chart, making it look visually appealing.
Step 3: Render the View Page
Next, add the following code in the view page,index.html.erb:
<div id="chart-container"></div>
<%= @chart.render() %>
Here the
render() method is used to render the above chart.
Now go to the path defined for the view page (automatically set at the time of creating the controller and the view) inside the config/routes.db to display the chart in the browser.
e.g. http://localhost:3000/static_fusioncharts/index
If all the above steps have been followed as instructed, the output should look like the image shown below:
If you see any errors in your code or have trouble executing, click here to download the complete source code of the sample project we have created for this tutorial.