
Driven by the need to digitally transform, companies are adopting agile development methods and cloud-native platforms to deliver applications faster and react quickly to customer’s needs. To take full advantage of these, having a Continuous Integration and Continuous Delivery (CI/CD) pipeline in place that automates the steps from building, testing, and delivering applications is a must. Even with a fully automated pipeline, one of the biggest challenges is moving the services from testing to production without impacting uptime or the user experience.
The blue-green deployment approach helps do this by ensuring you have two production environments as identical as possible available. At any time, either the blue or green version, let’s say blue for example, is live. As you prepare a new release of your software, you do your final stage of testing in the green environment. Once the software is working in the green environment, you switch the router so that all incoming requests go to the green environment. Consequently, the blue one is now idle.
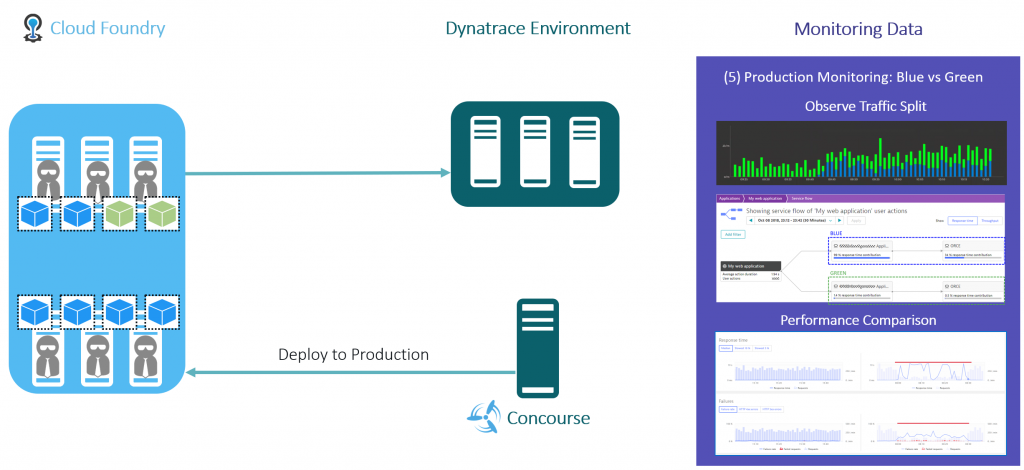
This blog post covers the topic of blue-green deployments in the context of Cloud Foundry while using Dynatrace to monitor the performance status of the different deployment environments. The demo application being referenced will be Dynatrace Sockshop, which is forked from the original Sockshop, a microservices demo application composed of eight services. These eight microservices are built, tested, and deployed to dev, staging, and production environments using Concourse.
Concourse for the CI/CD Pipeline
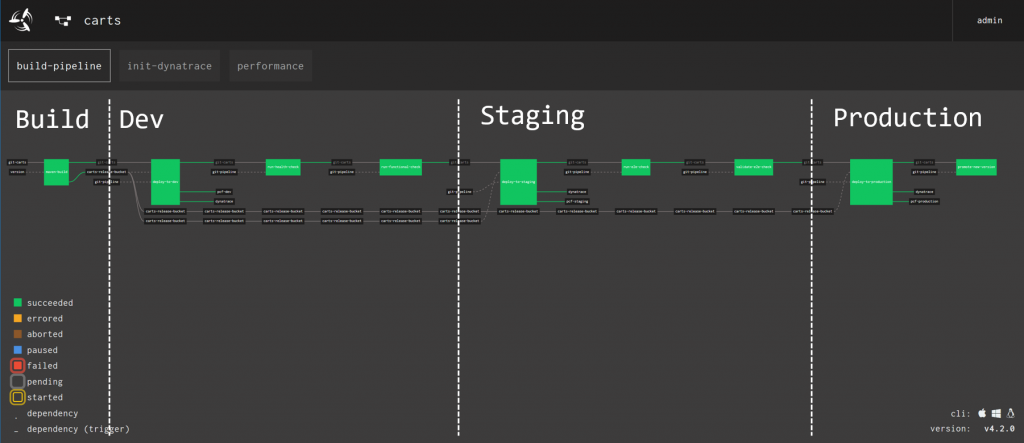
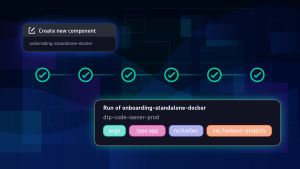
As mentioned above, Concourse is the CI/CD tool for this example and each microservice maintains its own CI/CD pipeline. In the screenshot below, the depicted pipeline of the carts service is composed of multiple steps that can be divided into four phases:
- Build: This phase checks-out the code repository and executes a build command depending on the programming language in which the service is written (Go, Java, or NodeJS). The outcome of this phase is an artifact (JAR or Go binary) that is ready to be deployed in Cloud Foundry.
- Dev: In this phase the artifact is deployed to a developer environment that includes a dedicated Cloud Foundry space named
dev. If the service is available in dev, a basic health check, as well as a functional check against the API, is conducted. - Staging: After successful checks in dev, the pipeline deploys the service to staging where a performance check is conducted. This check runs a JMeter script to simulate user interactions for a certain period. Afterward, a validation of the performance check, based on monitoring data from Dynatrace, verifies whether the test failed or passed.
- Production: The magic related to the deployment of microservices in a blue-green manner takes place at the end of the pipeline, during the production phase. The concepts underlying the two tasks that take place during this phase are explained in the Cloud Foundry documentation.
- Deploy-to-production: This step identifies whether the blue or green version of the service is currently live. If the green version is currently active, the new release of the carts service will be the blue version. Consequently, the application name of the carts service receives a postfix blue (i.e.,
carts-blue). - Promote-new-version: This step switches the route of real traffic from blue to green and vice versa.
- Deploy-to-production: This step identifies whether the blue or green version of the service is currently live. If the green version is currently active, the new release of the carts service will be the blue version. Consequently, the application name of the carts service receives a postfix blue (i.e.,
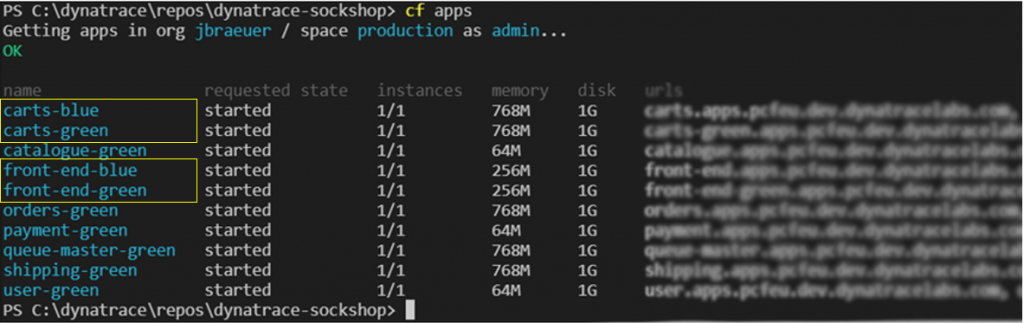
After triggering the pipeline for all eight microservices of Sockshop and deploying a green version, the CF production space appears as shown below. As you can see, the carts and front-end pipeline have been executed twice since there is a green and a blue version available (see yellow frames).
Dynatrace for monitoring a blue-green Deployment
To properly monitor the dev, staging, and production environments and to catch the blue-green deployment strategy, two Dynatrace configuration steps are necessary:
- A service naming rule needs to be in place to add the Cloud Foundry space and the web service name to the name of the microservice. This ensures that we can easily separate blue from green when looking at the Dynatrace monitored services.
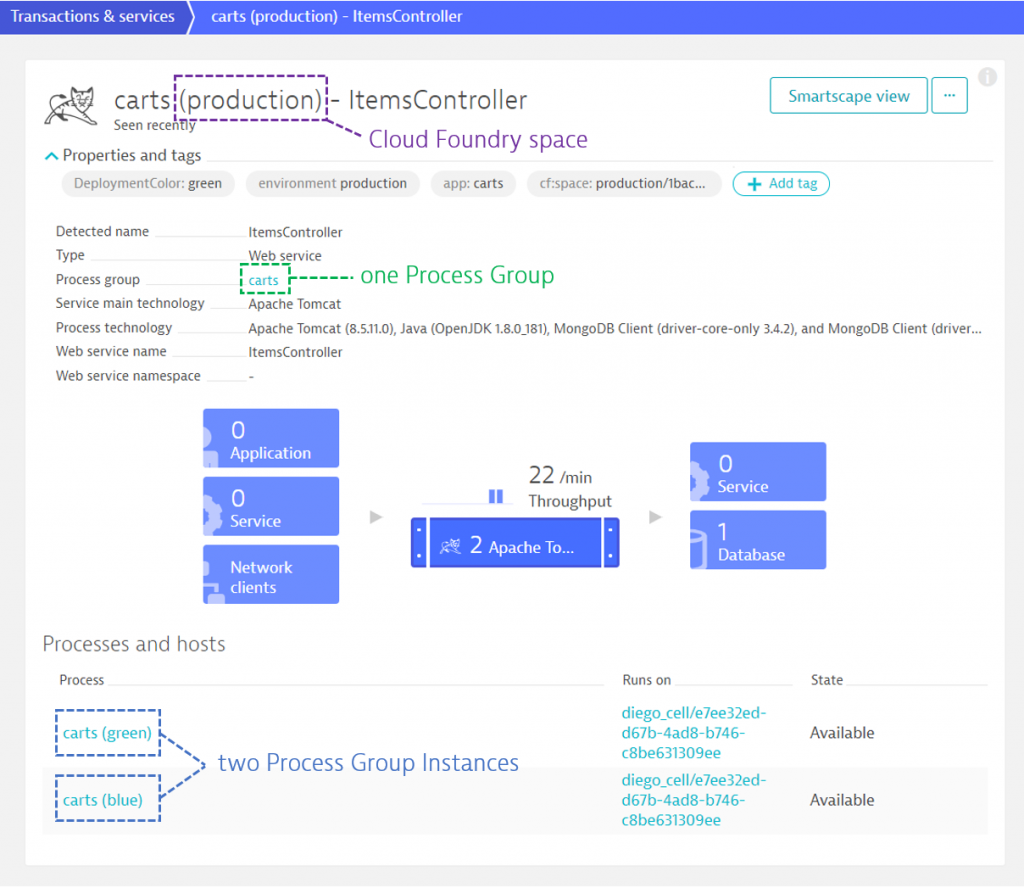
- The process group detection needs to be adjusted to differentiate the processes depending on the Cloud Foundry spaces. This allows us to get performance insights into each service and into each service instance (i.e., process group instance) by blue and green.
After setting up these two configurations, Dynatrace automatically detects our services as shown in the example below.
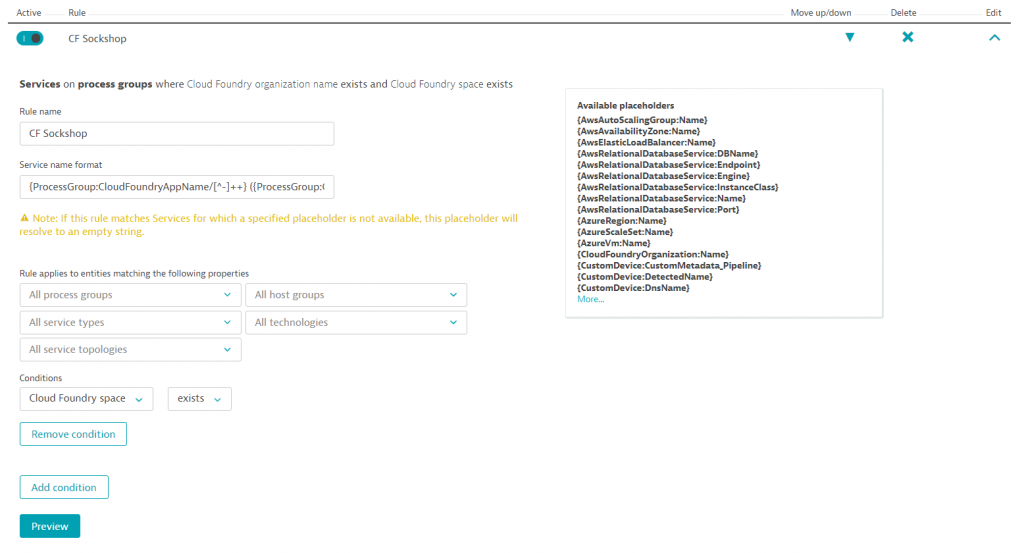
Service naming rule
To setup a service naming rule for this scenario, go to Settings > Server-side service monitoring > Service Naming rules. Click the Add new rule button to create a new service naming rule that defines following settings:
- Rule name:
Sockshop service naming rule - Service name format:
{ProcessGroup:CloudFoundryAppName/[^-]++} ({ProcessGroup:CloudFoundrySpaceName}) - {Service:WebServiceName}This format truncates the postfix from the service name, adds the Cloud Foundry space name in brackets, and attaches the web service name at the end.
- Conditions:
Cloud Foundry space > exists
Process group detection
The process group detection rule for the three environments can be configured under: Settings > Process groups > Process group detection. This time three rules are needed; one for each environment. Since the dev and staging environments are equal, except for their naming, the following screenshot shows the Process group detection rule for services in dev that are applicable for staging by simply changing the name.
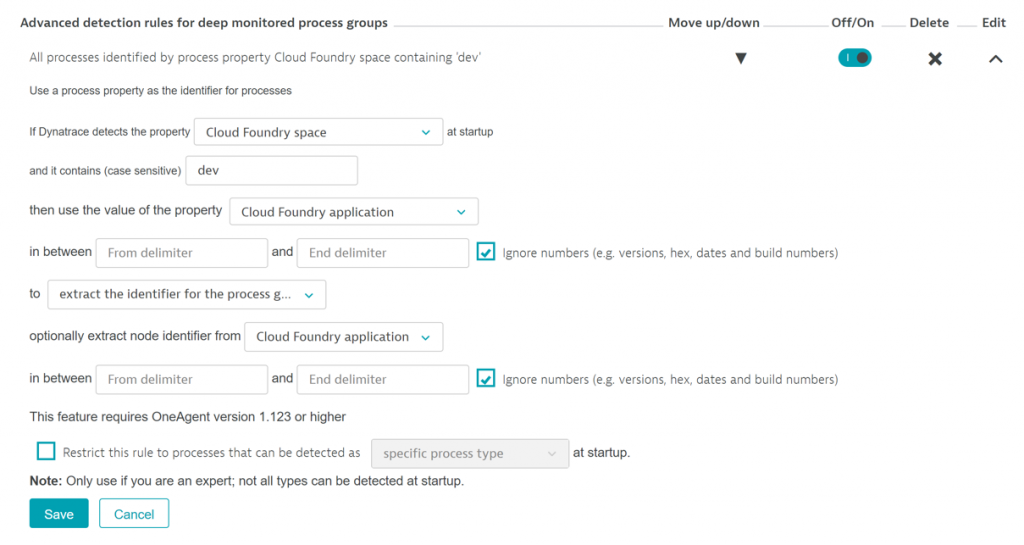
The production environment is different compared to the other environments as it contains each service in two versions. To deal with this, the node identifier for the process group needs to be extracted from the Cloud Foundry application, which is either carts-blue or carts-green. The unique identifier is the color that can be extracted by specifying `-` as the delimiter:

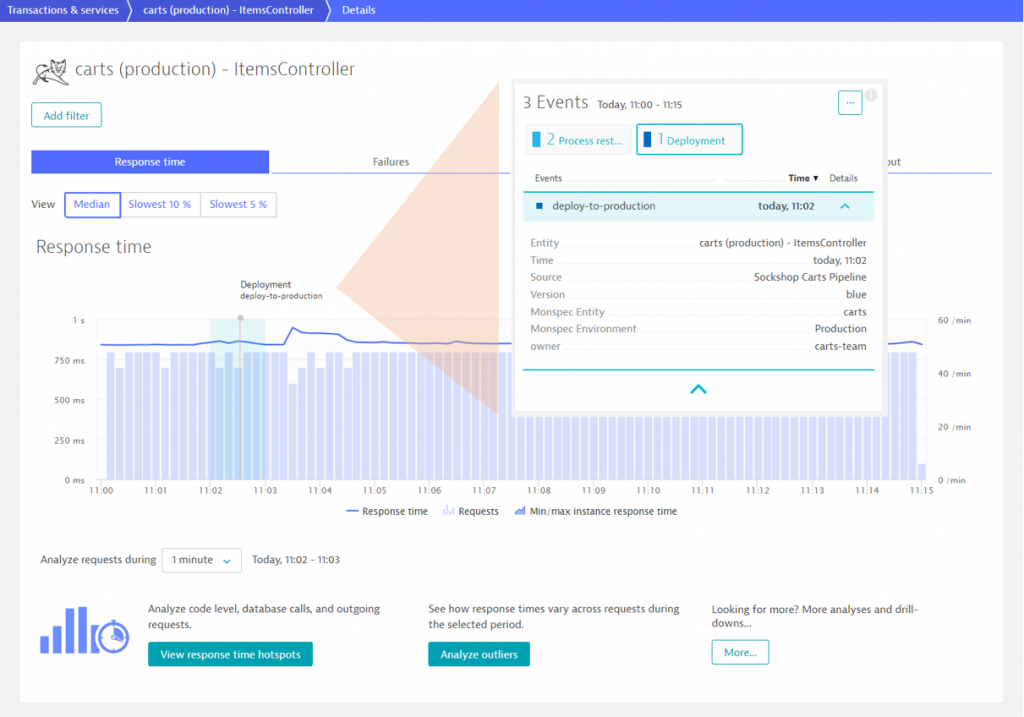
Blue/Green deployment in action
Based on the CI/CD Concourse pipeline and Dynatrace in the backend, we can deploy a new version of, for instance, the carts service without losing control or visibility along the delivery journey. To show this in action, we commit and push a change to the code repository of the carts service that automatically triggers the Concourse pipeline. After deploying it into the dev and staging environments, which puts the service to the test, a blue or green version will be deployed to production. This shows up in Dynatrace with an annotation in the timeline and an extra deployment event for the service entity.
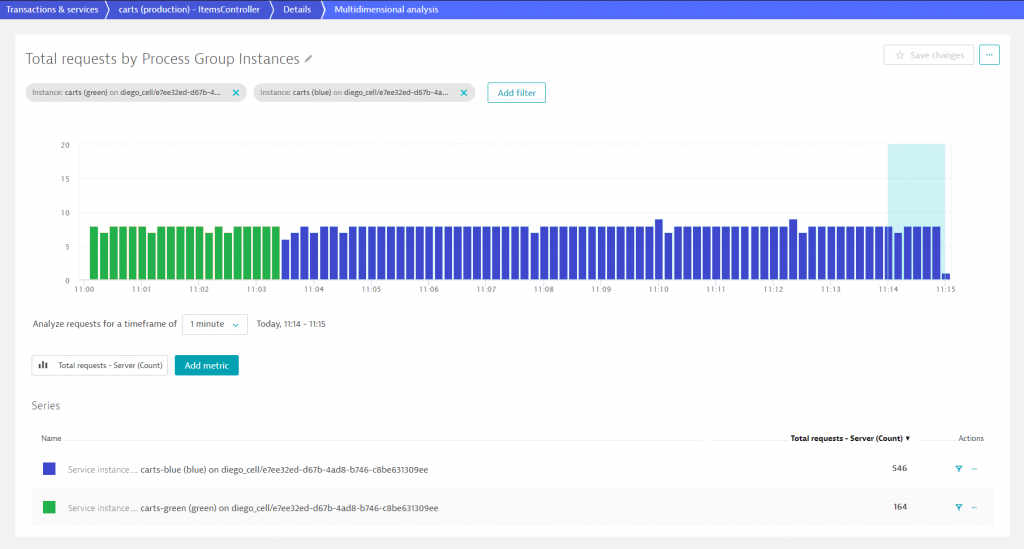
Additionally, we can look at the traffic that hits the new version (blue) by distinguishing the entire traffic on the carts service based on process group instances.
Outlook
Although Concourse is the preferred tool for CI tasks in the context of Cloud Foundry, it’s not the best choice for the CD part. To close this gap, Spinnaker is a better option. In a future post, I will change and extend the current example to a CI/CD pipeline that uses Concourse for building the microservices of the Dynatrace Sockshop and then Spinnaker to deliver the build artifacts to a staging and production space. Stay tuned to learn more and to see how smoothly Dynatrace integrates in this CI/CD pipeline.
If you want to monitor your services on Cloud Foundry, feel free to sign up for the Dynatrace free trial. Then follow the installation guide for OneAgent for Cloud Foundry and apply the best practices I described in this blog.
We’re always happy for your feedback, so please share your thoughts with us!


Looking for answers?
Start a new discussion or ask for help in our Q&A forum.
Go to forum