
For some time now, Dynatrace has provided code-level visibility into the performance of your Java, .NET, PHP, and Node.js applications. And in a world first, we recently added code-level monitoring of Golang applications.
In a major upgrade, we’re now proud to announce the following enhancements to code-level analysis views:
- Insights into process and process group hotspots
- Access to background activity, service activity, specific types of requests, and single request executions
- Data breakdown and filtering by code execution, network I/O, disk I/O, lock time, and wait times over time
- Data breakdown and filtering by API over time
- Visibility into forward stack traces as well as hotspots with reverse stack traces
- Support for Java, .NET, PHP, Node.js, and Golang
Access code-level analysis view
The new detailed code-level analysis view can be found on all pages where you can drill into code-level analysis:
- CPU profiler (code-level)
- Service method hotspots
- Service response time hotspots
- Individual PurePaths
To illustrate how this works, we’ll analyze the hotspots of a specific process in a real-world example.
To perform code-level analysis on a process:
- From the navigation menu, select Diagnostic tools > CPU analysis.
- Select the process group that contains the process you want to analyze.
- Within the row of the specific process you want to analyze, click the Show code level button to display that process’ Hotspots page (see example below).
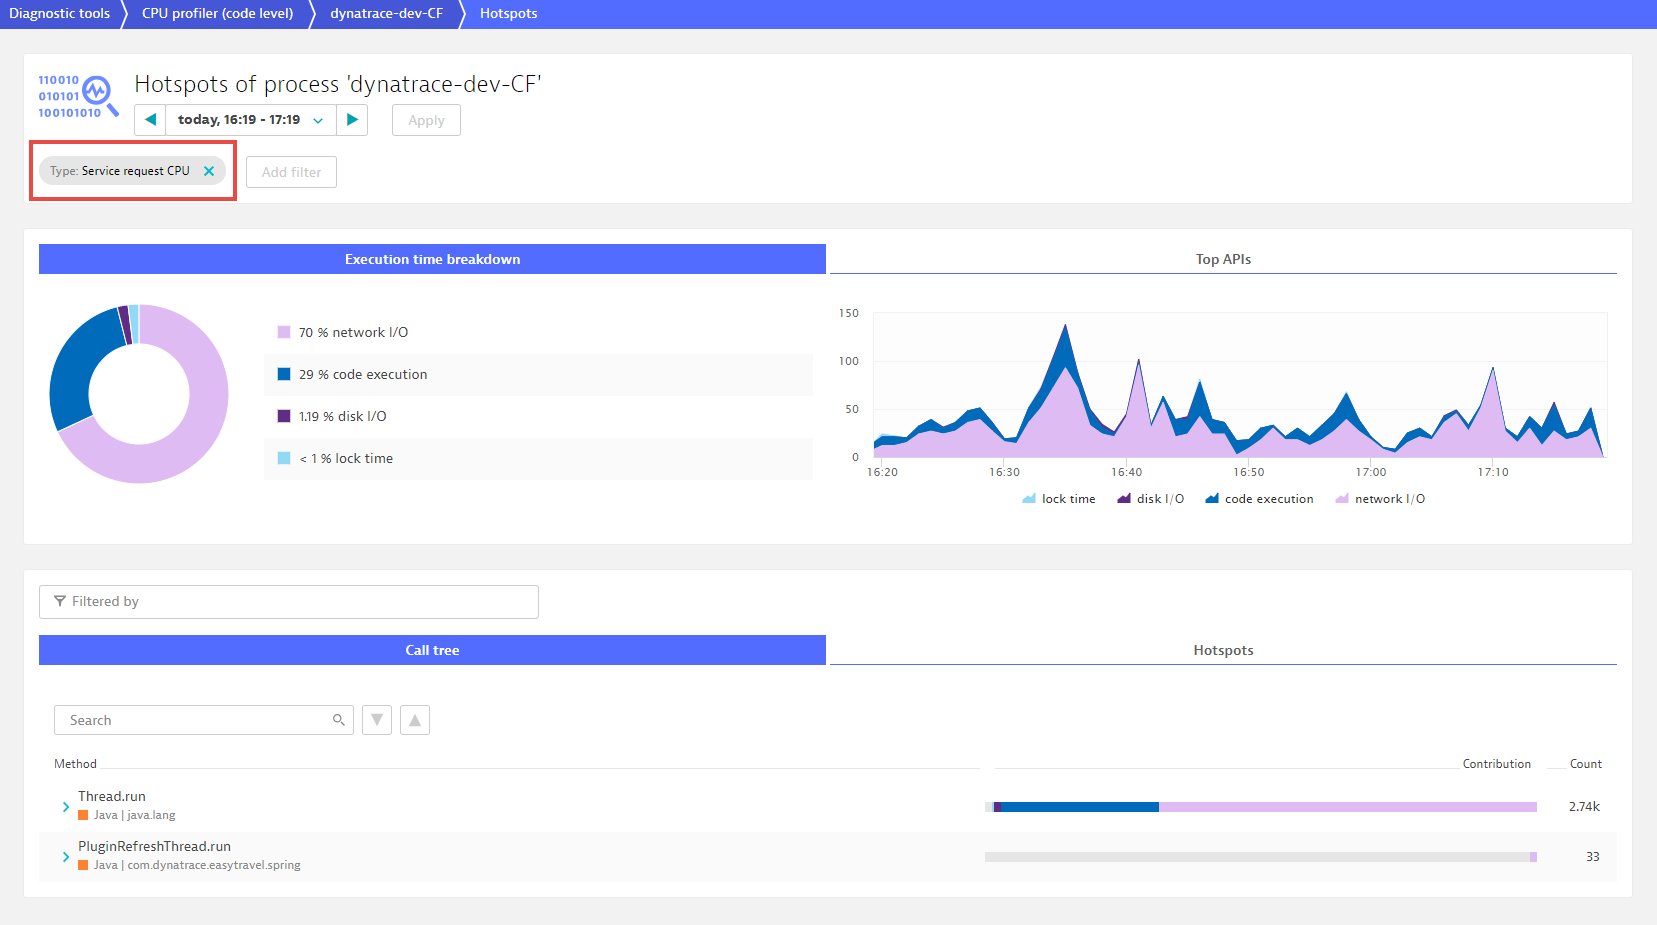
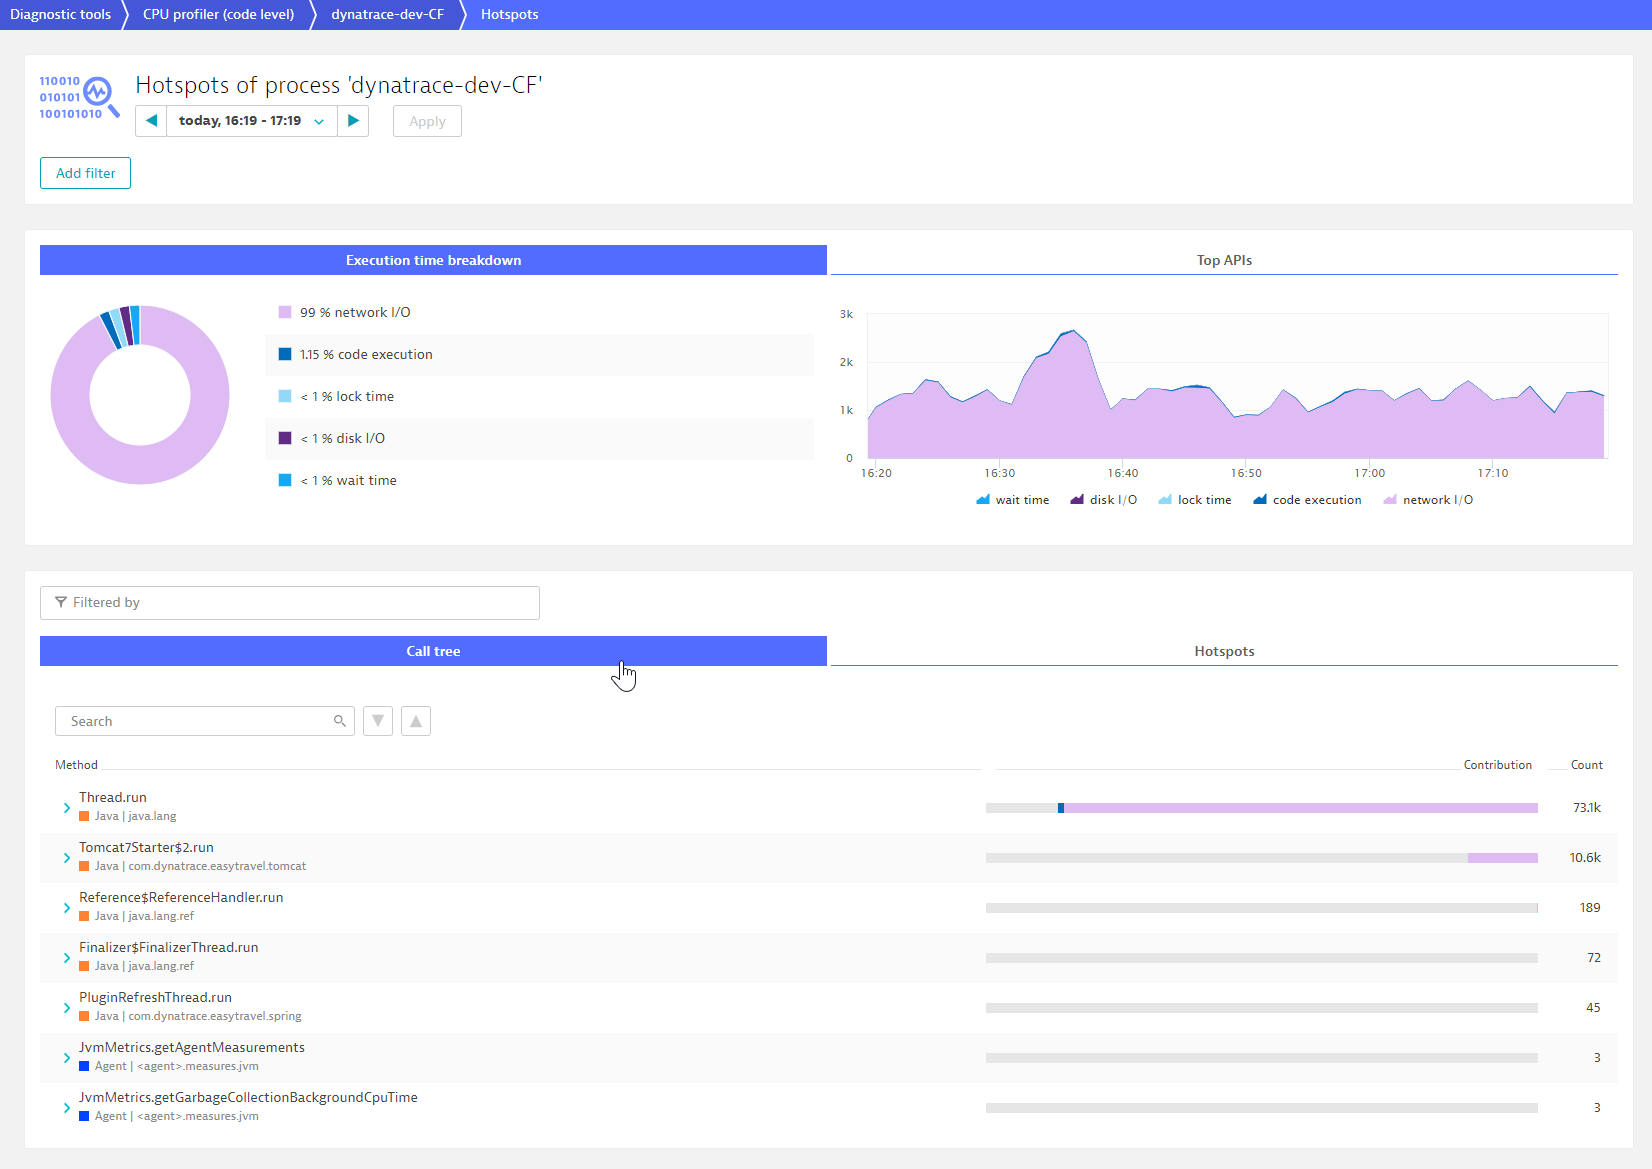
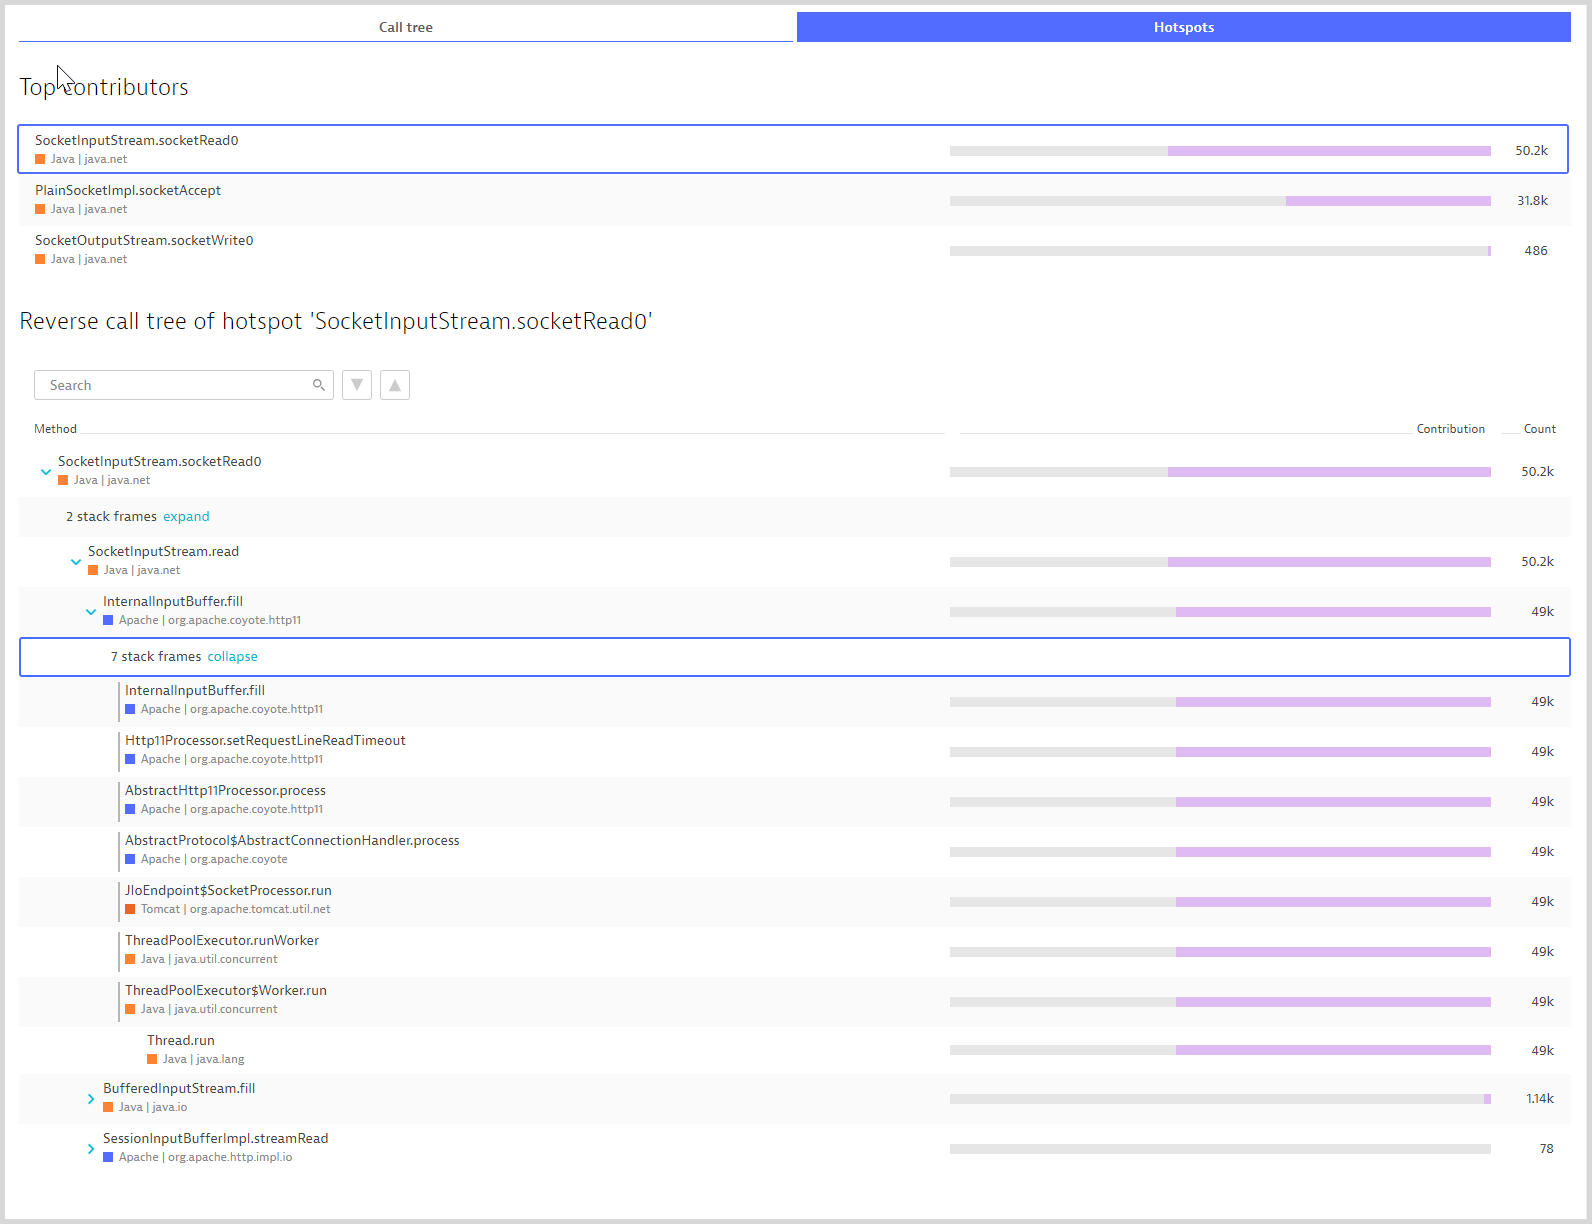
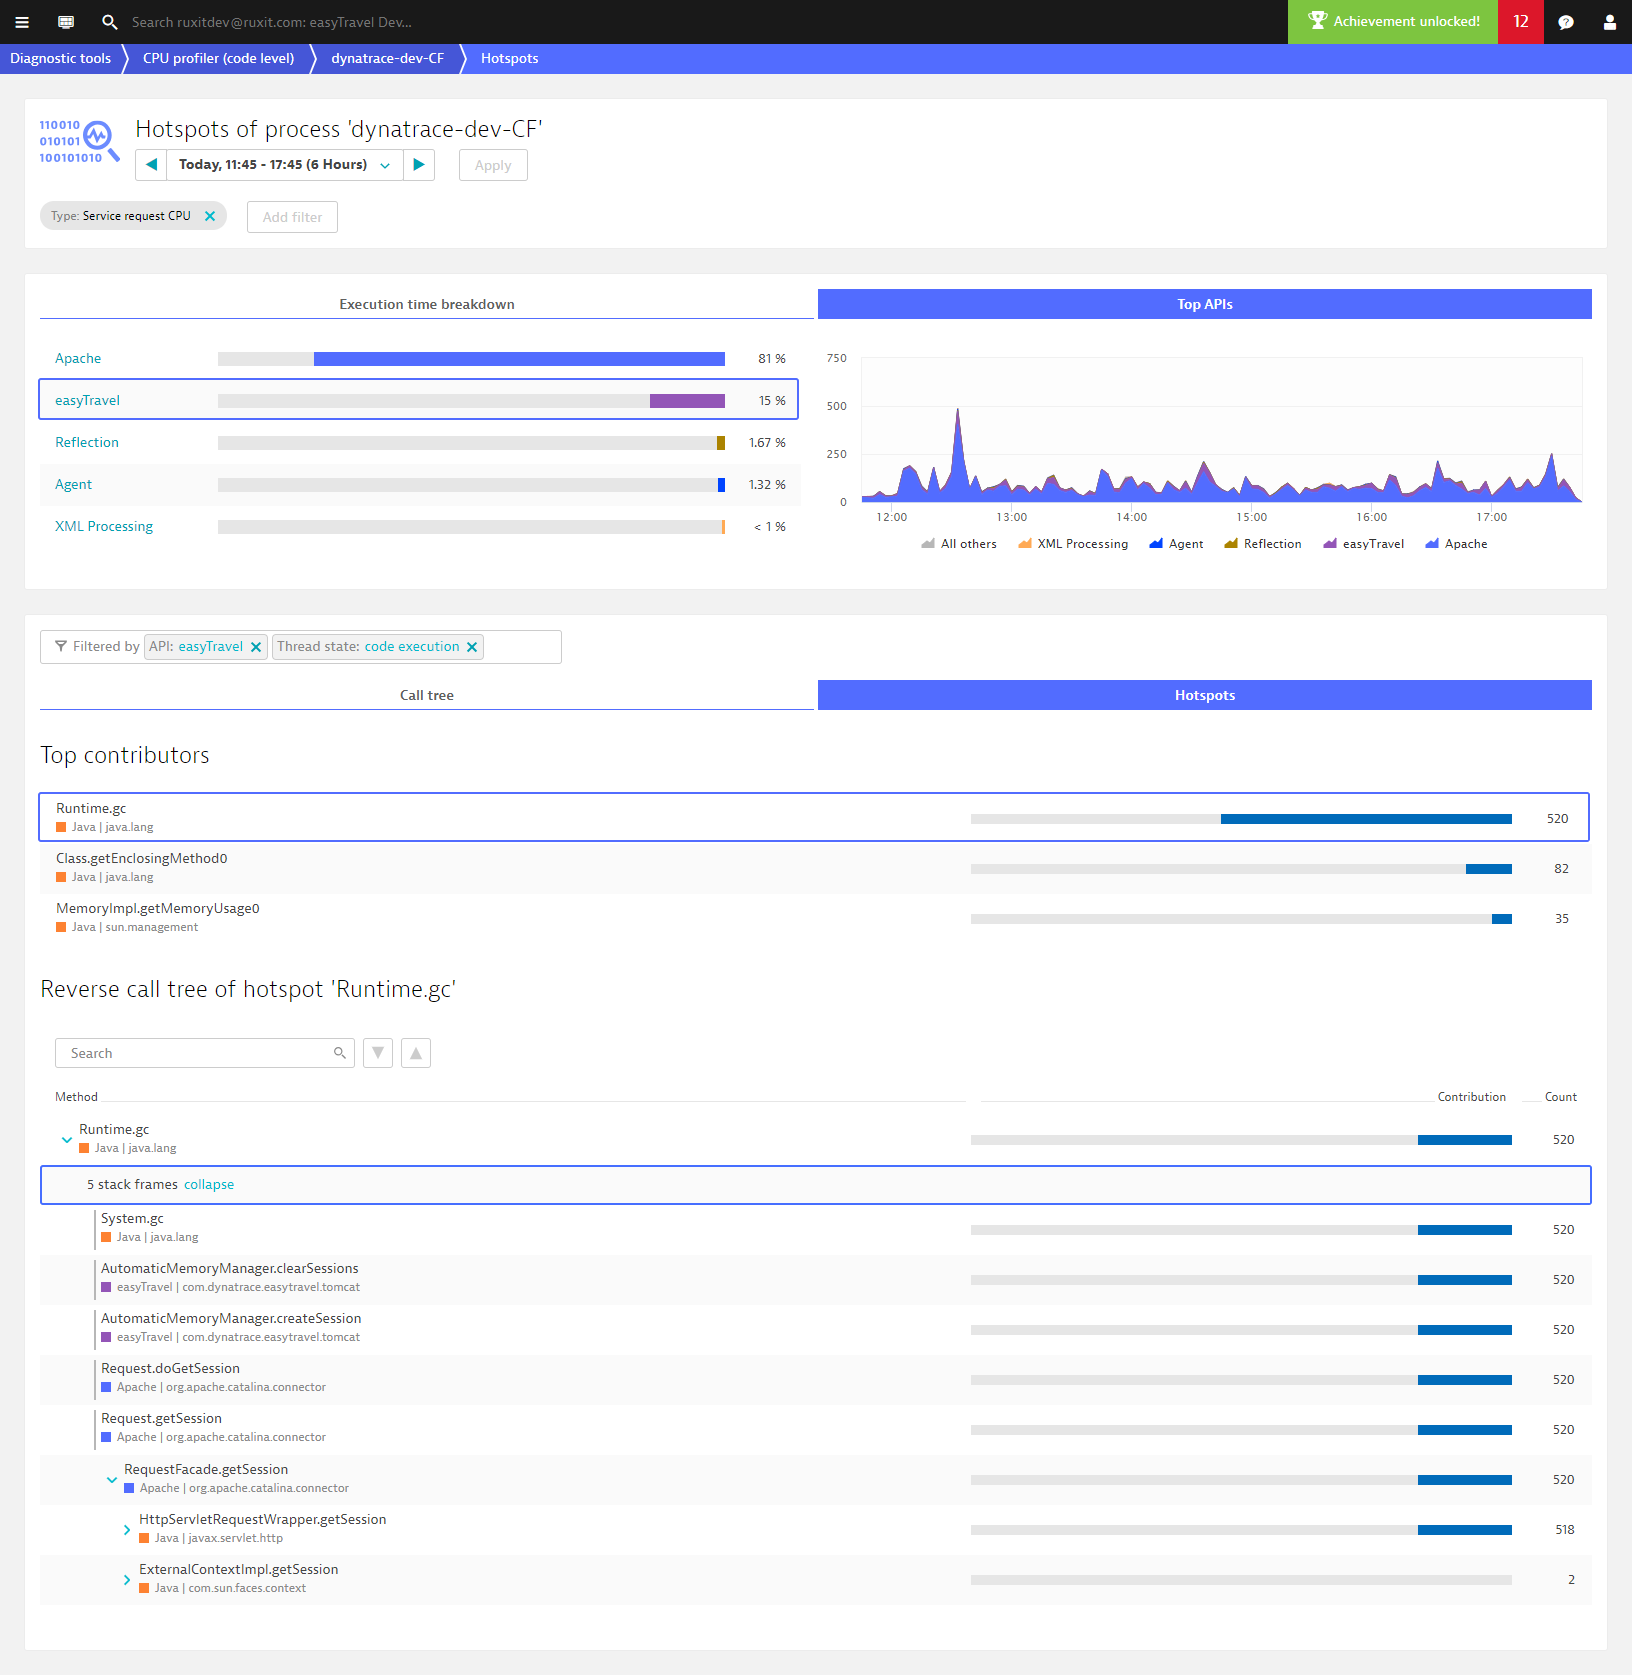
To analyze the entire process group, remove the filter (Service request CPU in this example). Notice in the example below that this process spends most of its time in network I/O. The color coding of the pie chart, the area chart, and the bars in the code-level stack traces all reflect this to facilitate code-level diagnostics.
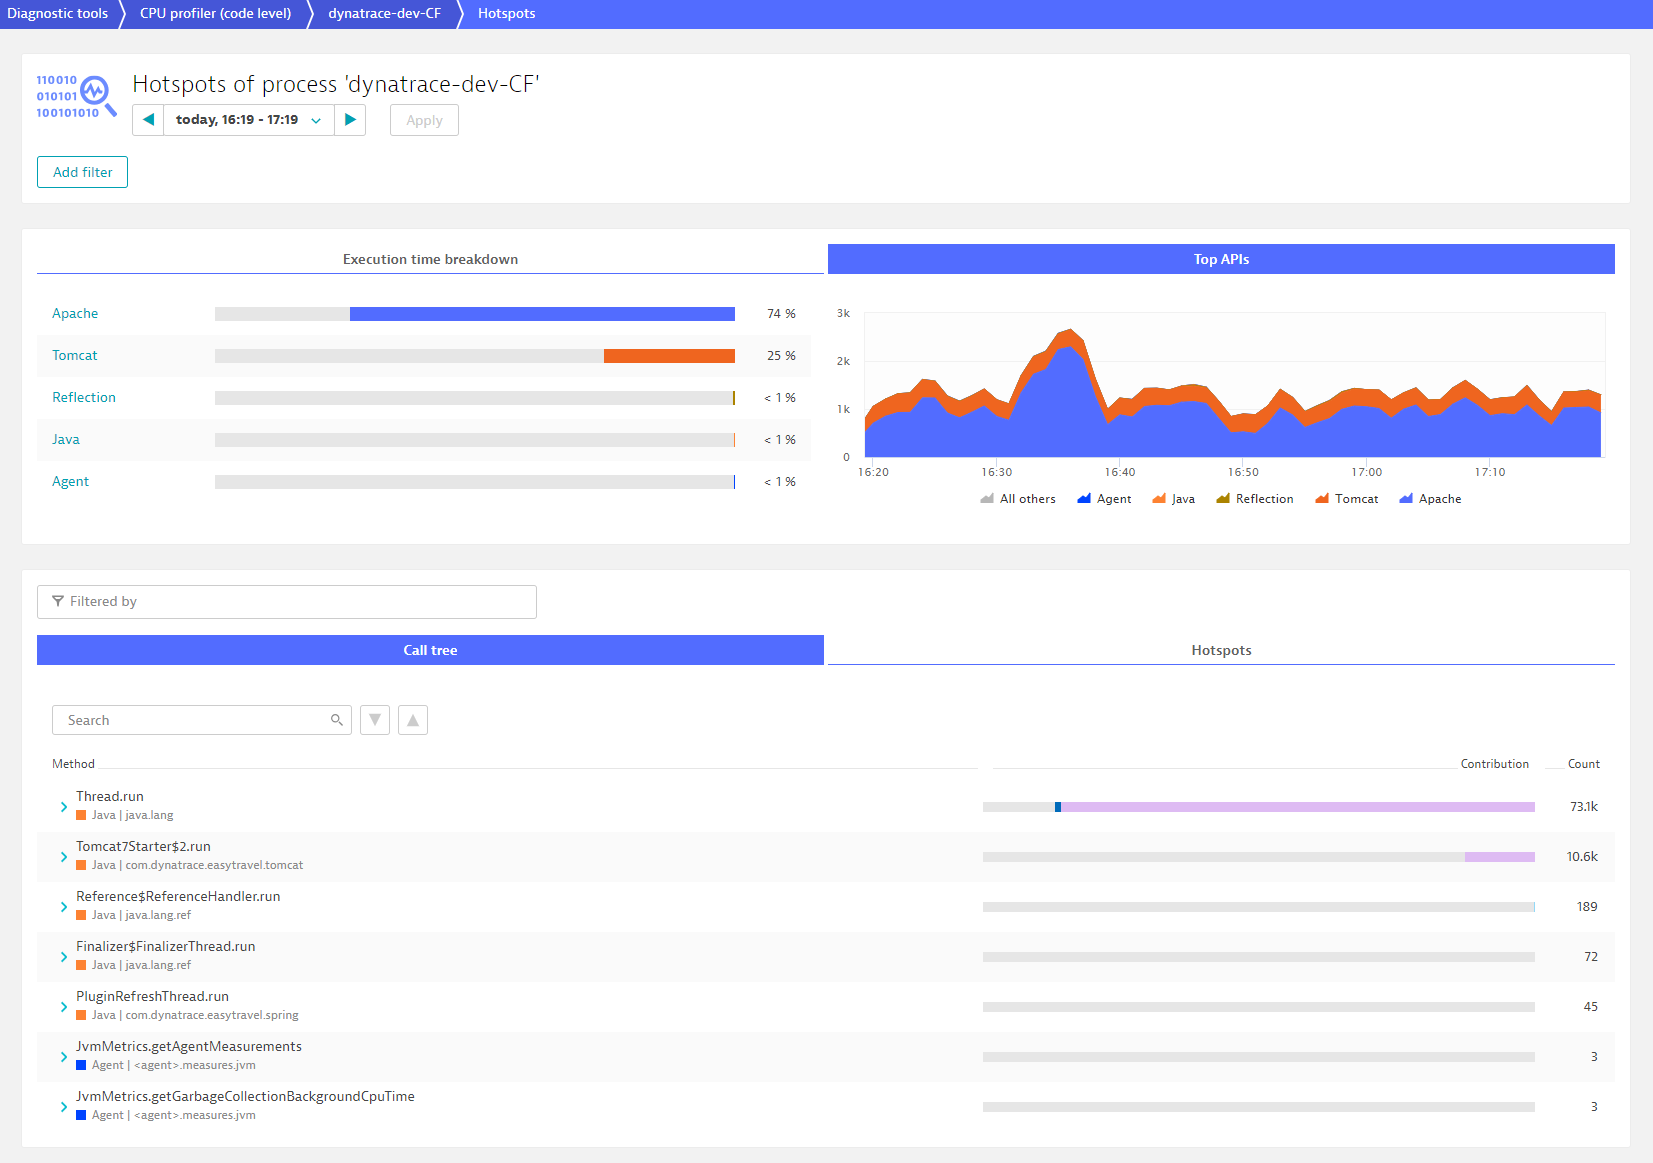
Click the Top APIs tab to access to the API breakdown. The list of APIs is configurable (see How to configure APIs below for details).
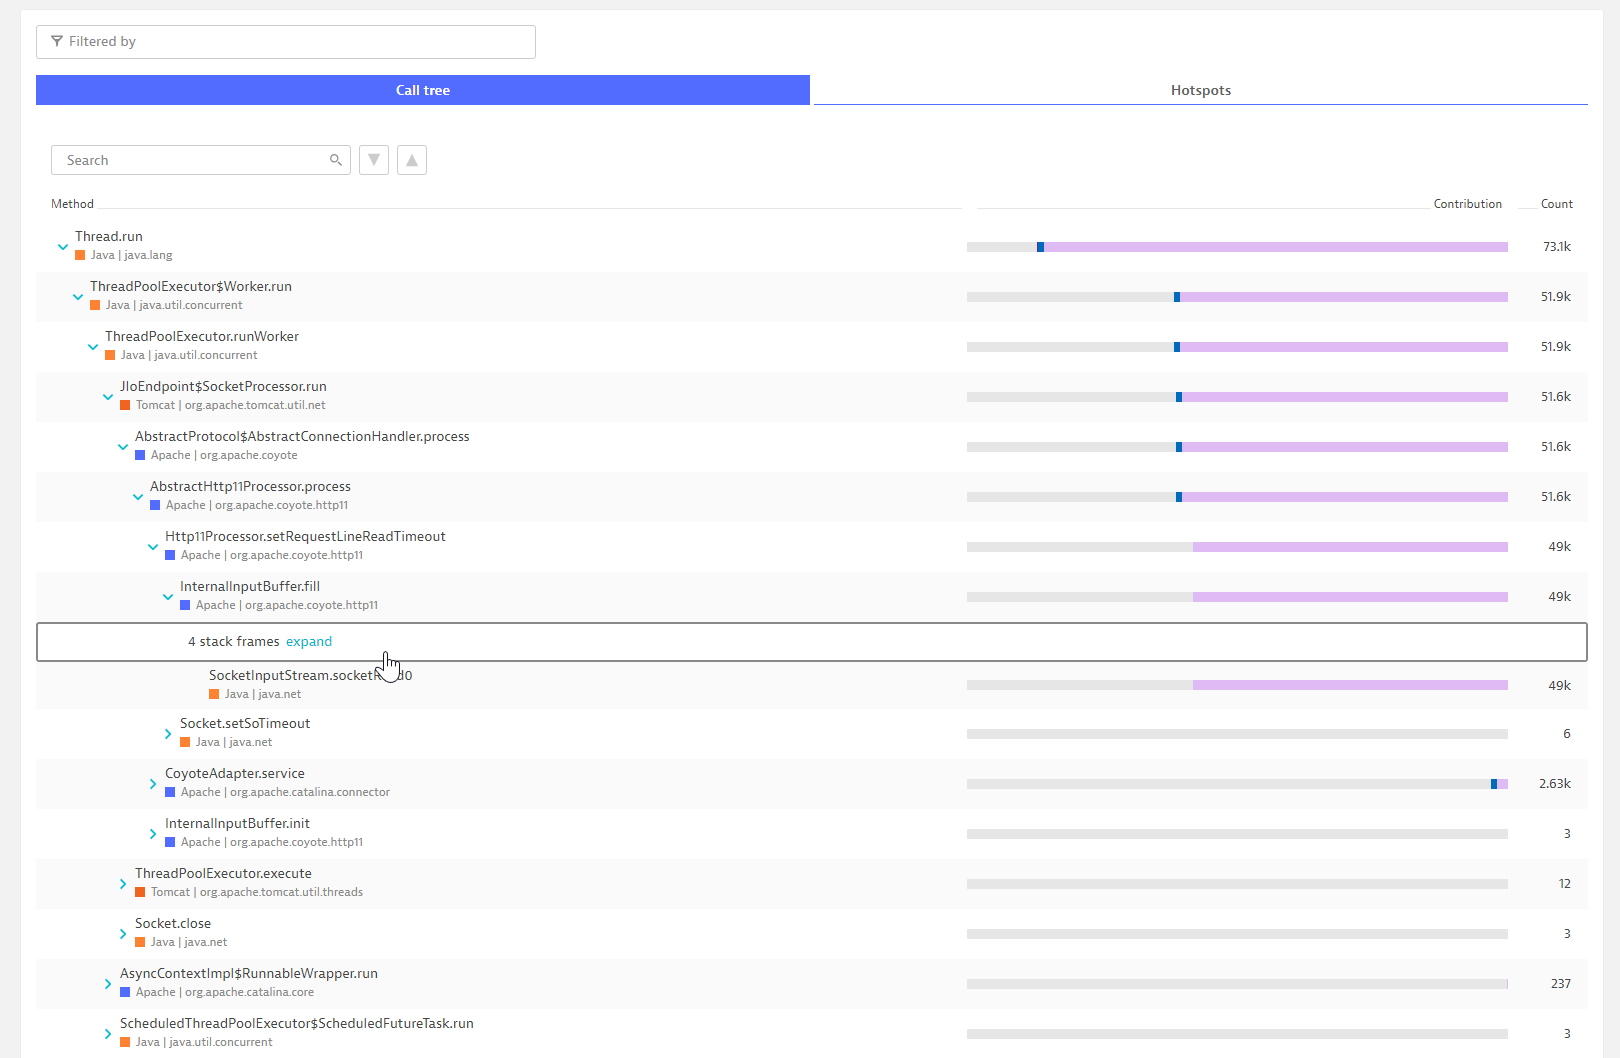
Click the Call tree tab to view the forward stack trace. Each listed method is tagged with the name and color of the API. We strive to focus on the important things in this redesigned view, so if you see collapsed frames, it’s because the contribution is the same as the frame above and doesn’t add new information. You can, of course, still expand these to view them.
Click the Hotspots tab to view the top three hotspots along with reverse stack traces (something that developers will love).
What makes our code-level views so powerful is that when you filter the execution times and top APIs, the Call tree and Hotspots views inherit your defined filters. In the example below, to filtering based on code execution and Apache (on the Execution time breakdown tab, select code execution, and on the Top APIs tab, select Apache) reveals that most Apache API execution time is within the call Runtime.gc. This is rather curious, but opening the stack frames reveals the culprit—an explicit GC call by the easyTravel Memory Manager.
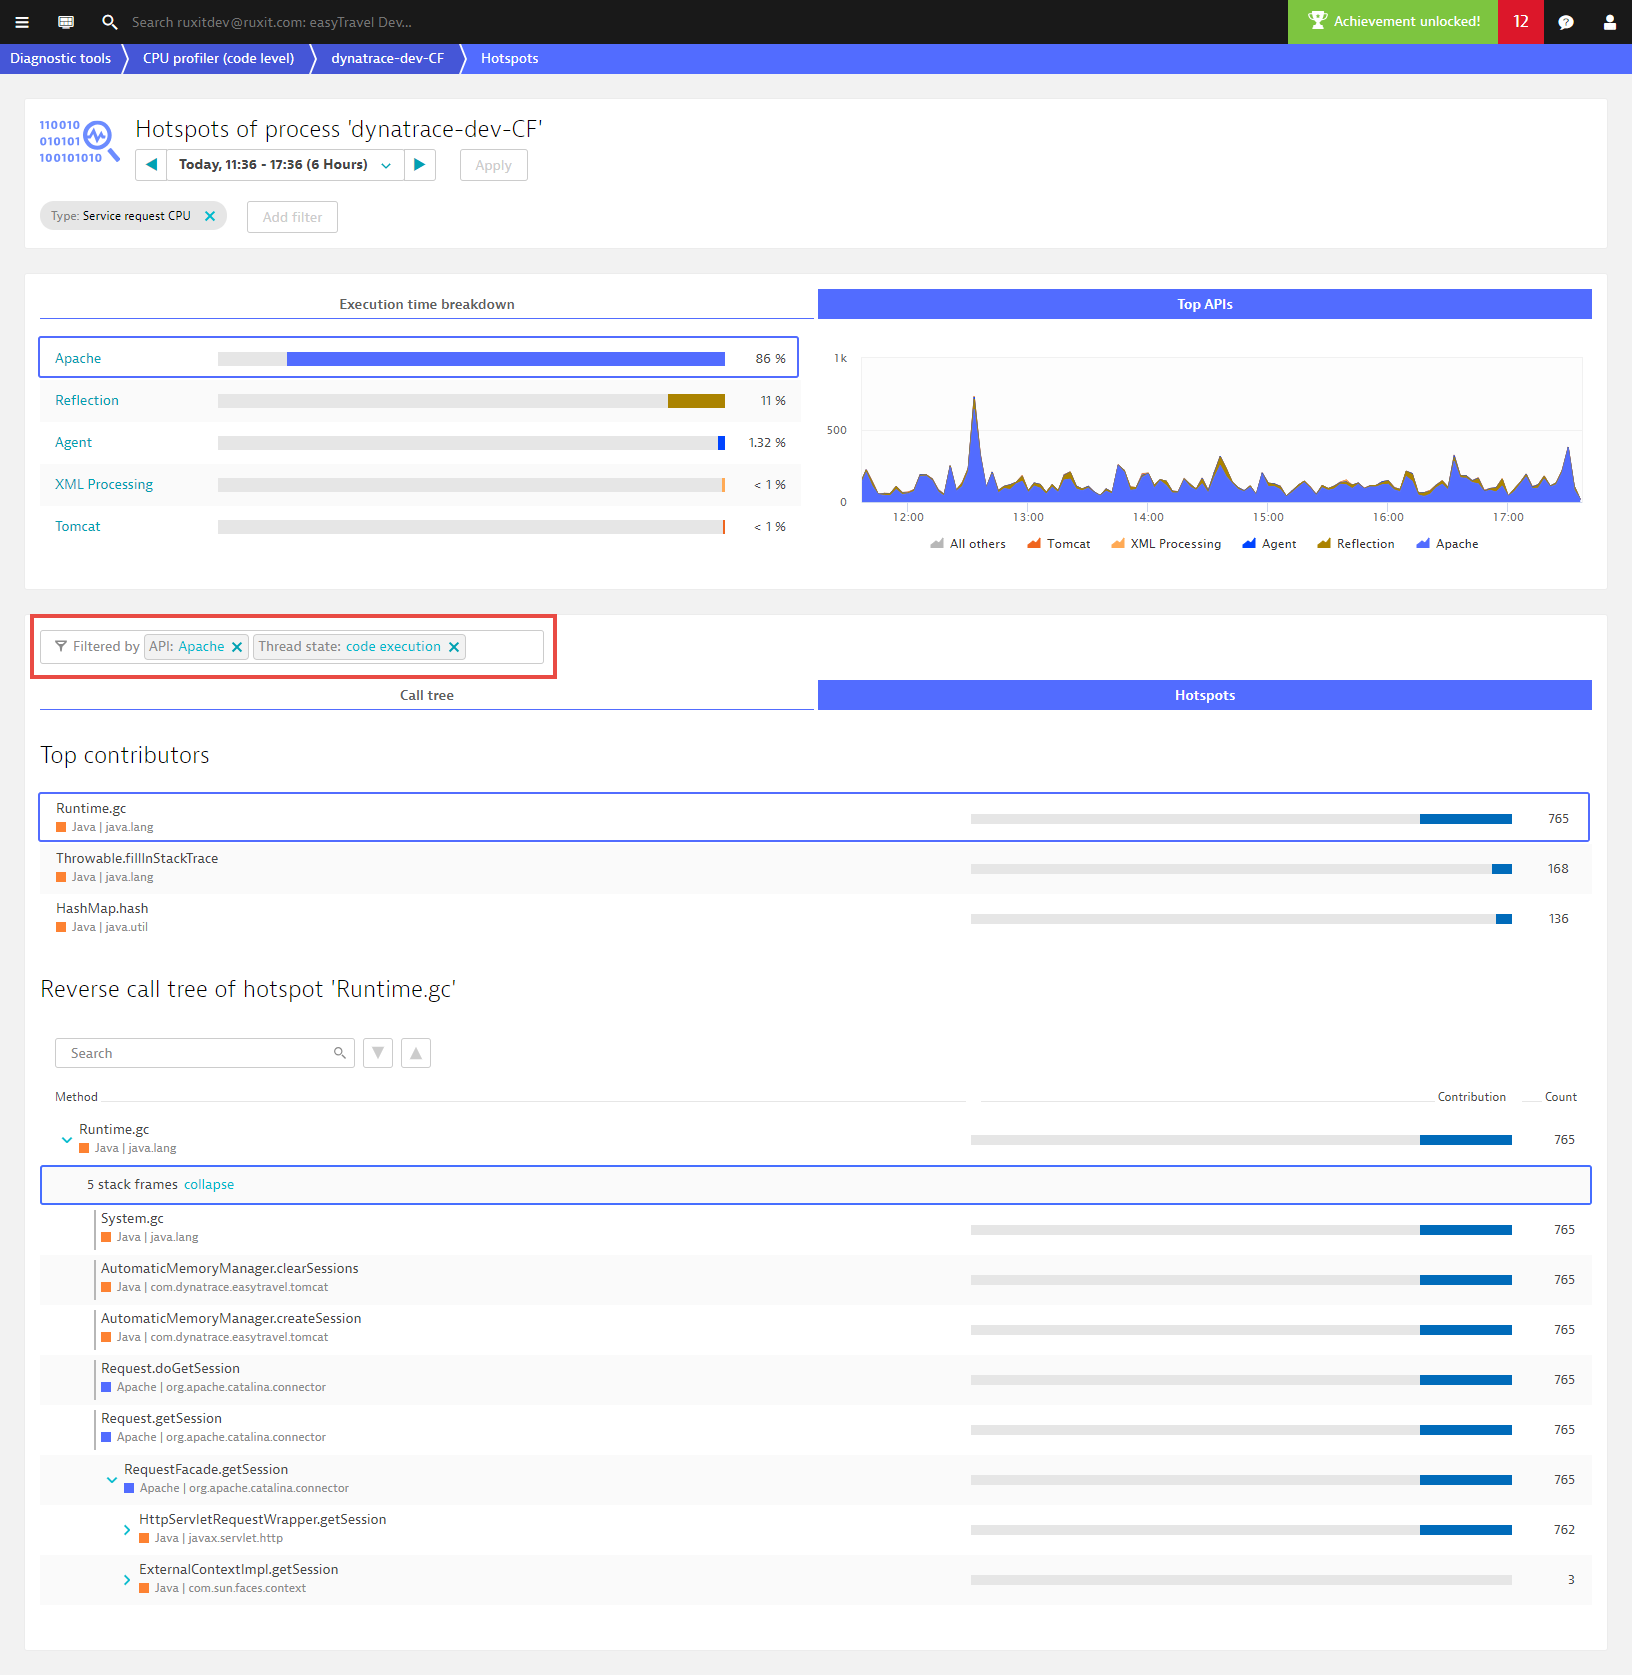
You may ask, why “Apache API”? We’ve decided to treat certain APIs as “runtime” and only show them in the Top APIs list when no other APIs are found. The next API in the stack trace shown is Apache. This makes sense, otherwise, network, disk, and lock times would always be part of the Java API.
User-defined APIs
Modern applications use many frameworks, and Dynatrace comes with a set of predefined APIs. For some languages like Node.js and Golang, Dynatrace provides detection based on modules and packages. We’ve defined a basic set of predefined APIs for Java and .NET, but there are of course many others. This is why we enable you to create custom API definitions for the various frameworks in your environment. Custom API definitions are used to further segment the API breakdown and make it easier to quickly see which frameworks contain hotspots.
In the examples above, we discovered that the Apache framework is responsible for the explicit GC call. However, the actual culprit here is part of the easyTravel code. For filtering and analysis purposes, it will make things easier if Dynatrace marks these methods separately. To do this, we’ll create a new, custom API definition called easyTravel. This will enable Dynatrace to identify all easyTravel related method calls as being part of the easyTravel-specific code.
To add a user-defined API detection rule:
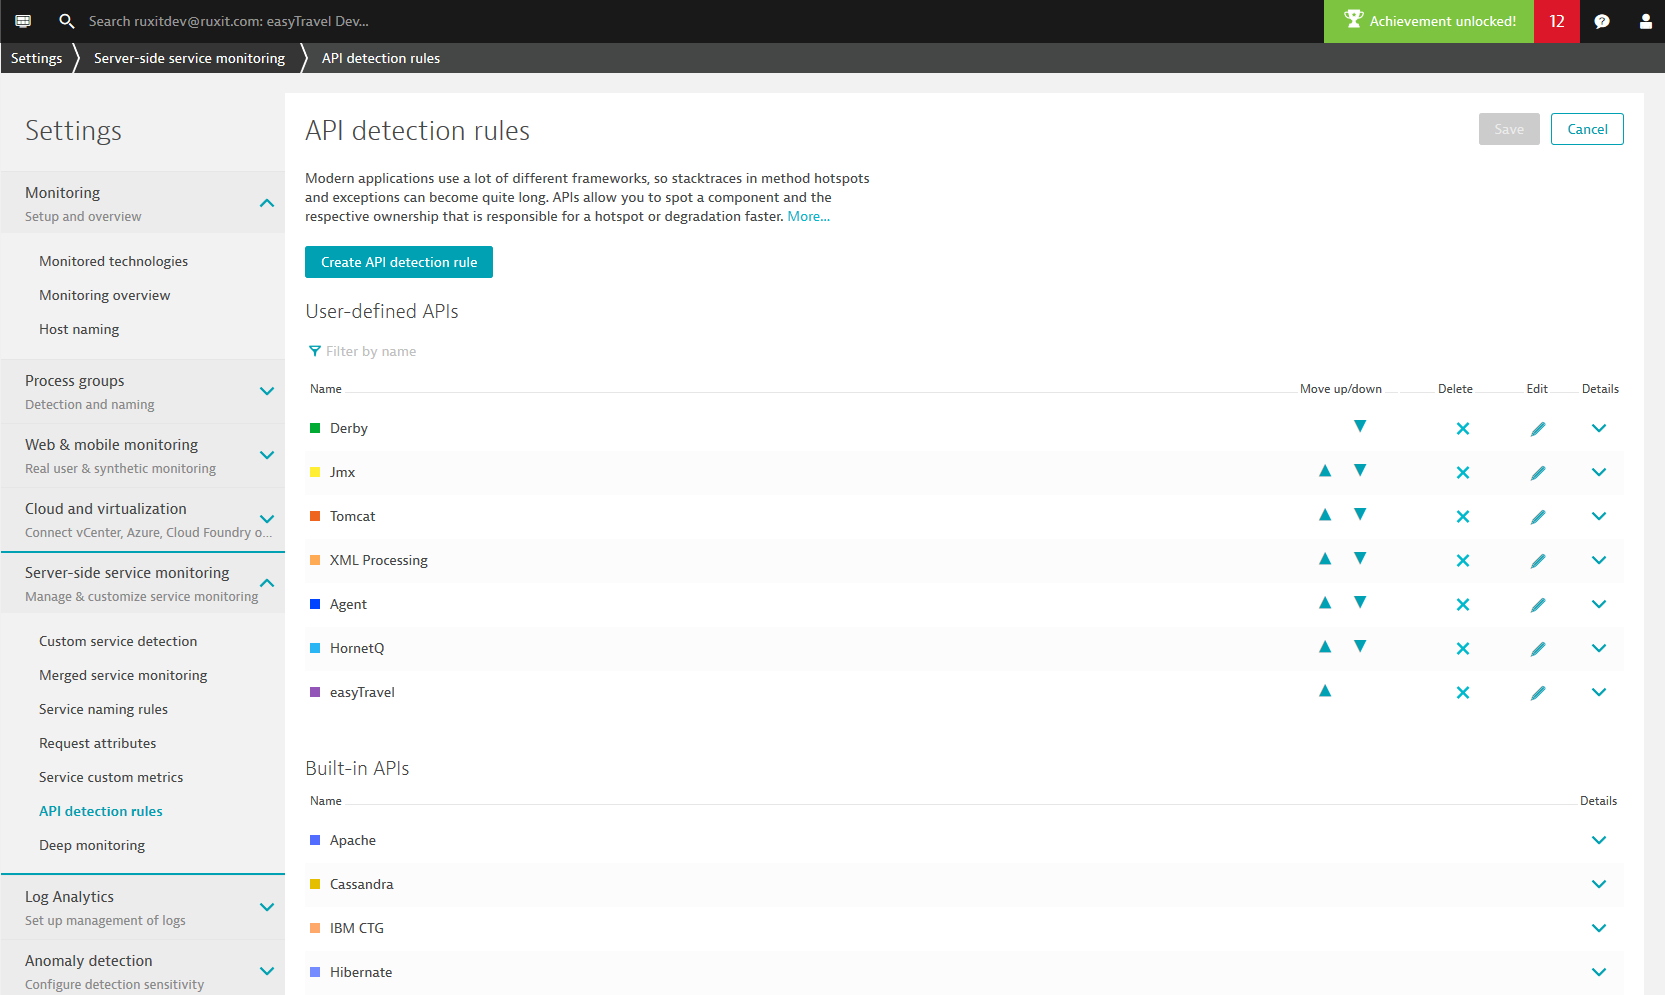
- Go to Settings > Server-side service monitoring > API detection rules.
- Click the Create API detection rule button.
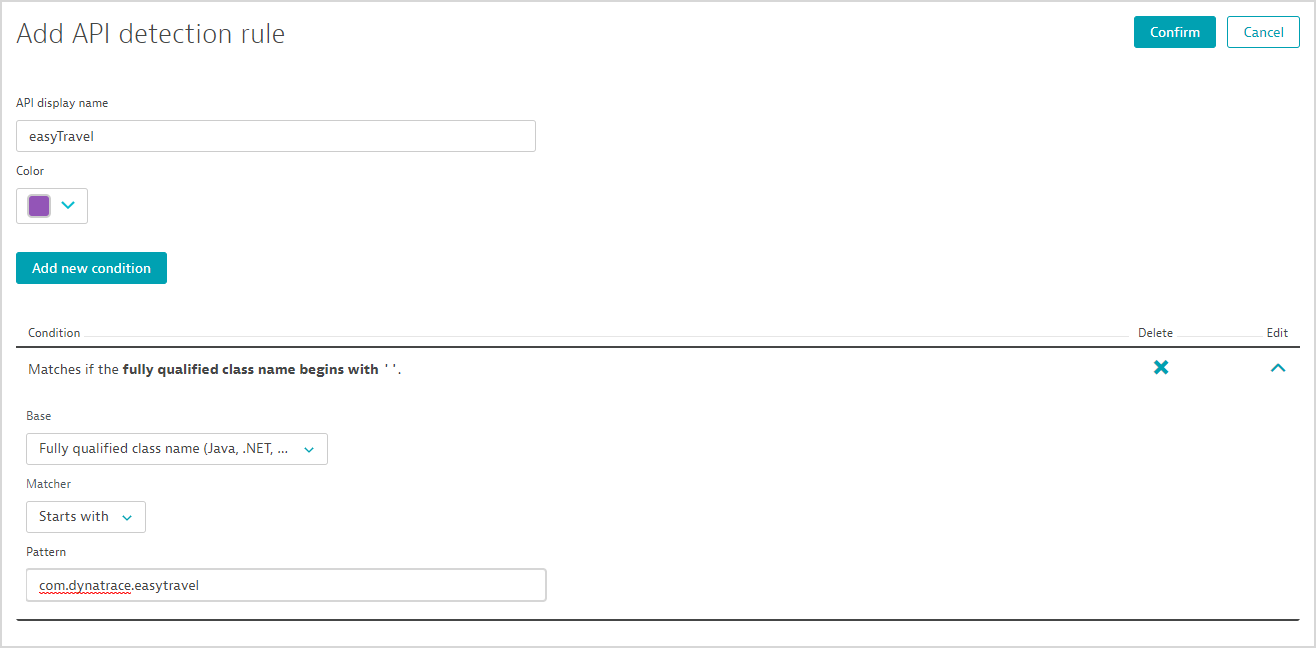
- Type a name for the new API. In this example, we’ll use easyTravel.
- Click the Add new condition button. The pattern to be used to identify the API in this example is
com.dynatrace.easytravel. - Click Confirm to save the new API detection rule.
The new API detection rule goes into effect almost immediately. Performing the same analysis as detailed above, you can see that the new user-defined easyTravel API is now included in the code-level analysis.
This major overhaul should open a wide variety of use cases to you and is available not only in Diagnostic tools but in any Service view as well. Keep a watch out for the many more features we have planned here.
Start a free trial!
Dynatrace is free to use for 15 days! The trial stops automatically, no credit card is required. Just enter your email address, choose your cloud location and install our agent.


Looking for answers?
Start a new discussion or ask for help in our Q&A forum.
Go to forum