
speedscope is a fast, interactive, web-based viewer for large performance profiles (www.speedscope.app, github.com/jlfwong/speedscope). It’s inspired by the performance panel of Chrome Devtools and by Brendan Gregg’s FlameGraphs. If you’ve never heard of flamegraphs before or if you’ve heard of them but never understood how to read them, the guide “Using flamegraphs” from rbspy’s documentation is wonderful.
The goal of speedscope is to provide a 60fps way of interactively exploring large performance profiles from a variety of profilers for a variety of programming languages. It runs totally in-browser, and does not send any profiling data to any servers. Because it runs totally in-browser, it should work in Firefox and Chrome on Mac, Windows, and Linux. It can be downloaded to run offline, either from npm, or just as a totally standalone zip file.
In doing performance work across many language environments at Figma, I noticed that every community tends to create its own tools for visualizing performance issues. With speedscope, I hoped to de-duplicate those efforts. To meet this goal, speedscope supports import of profiles from a growing list of profilers:
JavaScript
Ruby
Go
Haskell
Native code
- Importing from Instruments.app (macOS)
- Importing from
perf(linux)
speedscope also has a stable documented file format, making it appropriate as a tool to target for visualization of totally custom profiles. This allows new profilers to support import into speedscope without needing to modify speedscope’s code at all (though contributions are welcome!). This is how I added support for visualizing rbspy profiles: rbspy#161. Firefox & Chrome both have capable profile visualizers, but the file formats they use change frequently.
Also unlike other similar tools, speedscope is designed to make it easy to host inside your own infrastructure. This allows you to integrate speedscope to view backend performance profiles with a single click. At Figma, we have a ruby backend, so I made an opinionated fork of rack-mini-profiler to do exactly this. If you support access to performance profiles across domains, you can even load them directly into https://www.speedscope.app via a #profileUrl=… hash parameter.
What can it do?
speedscope is broken down into three primary views: Time Order, Left Heavy, and Sandwich.
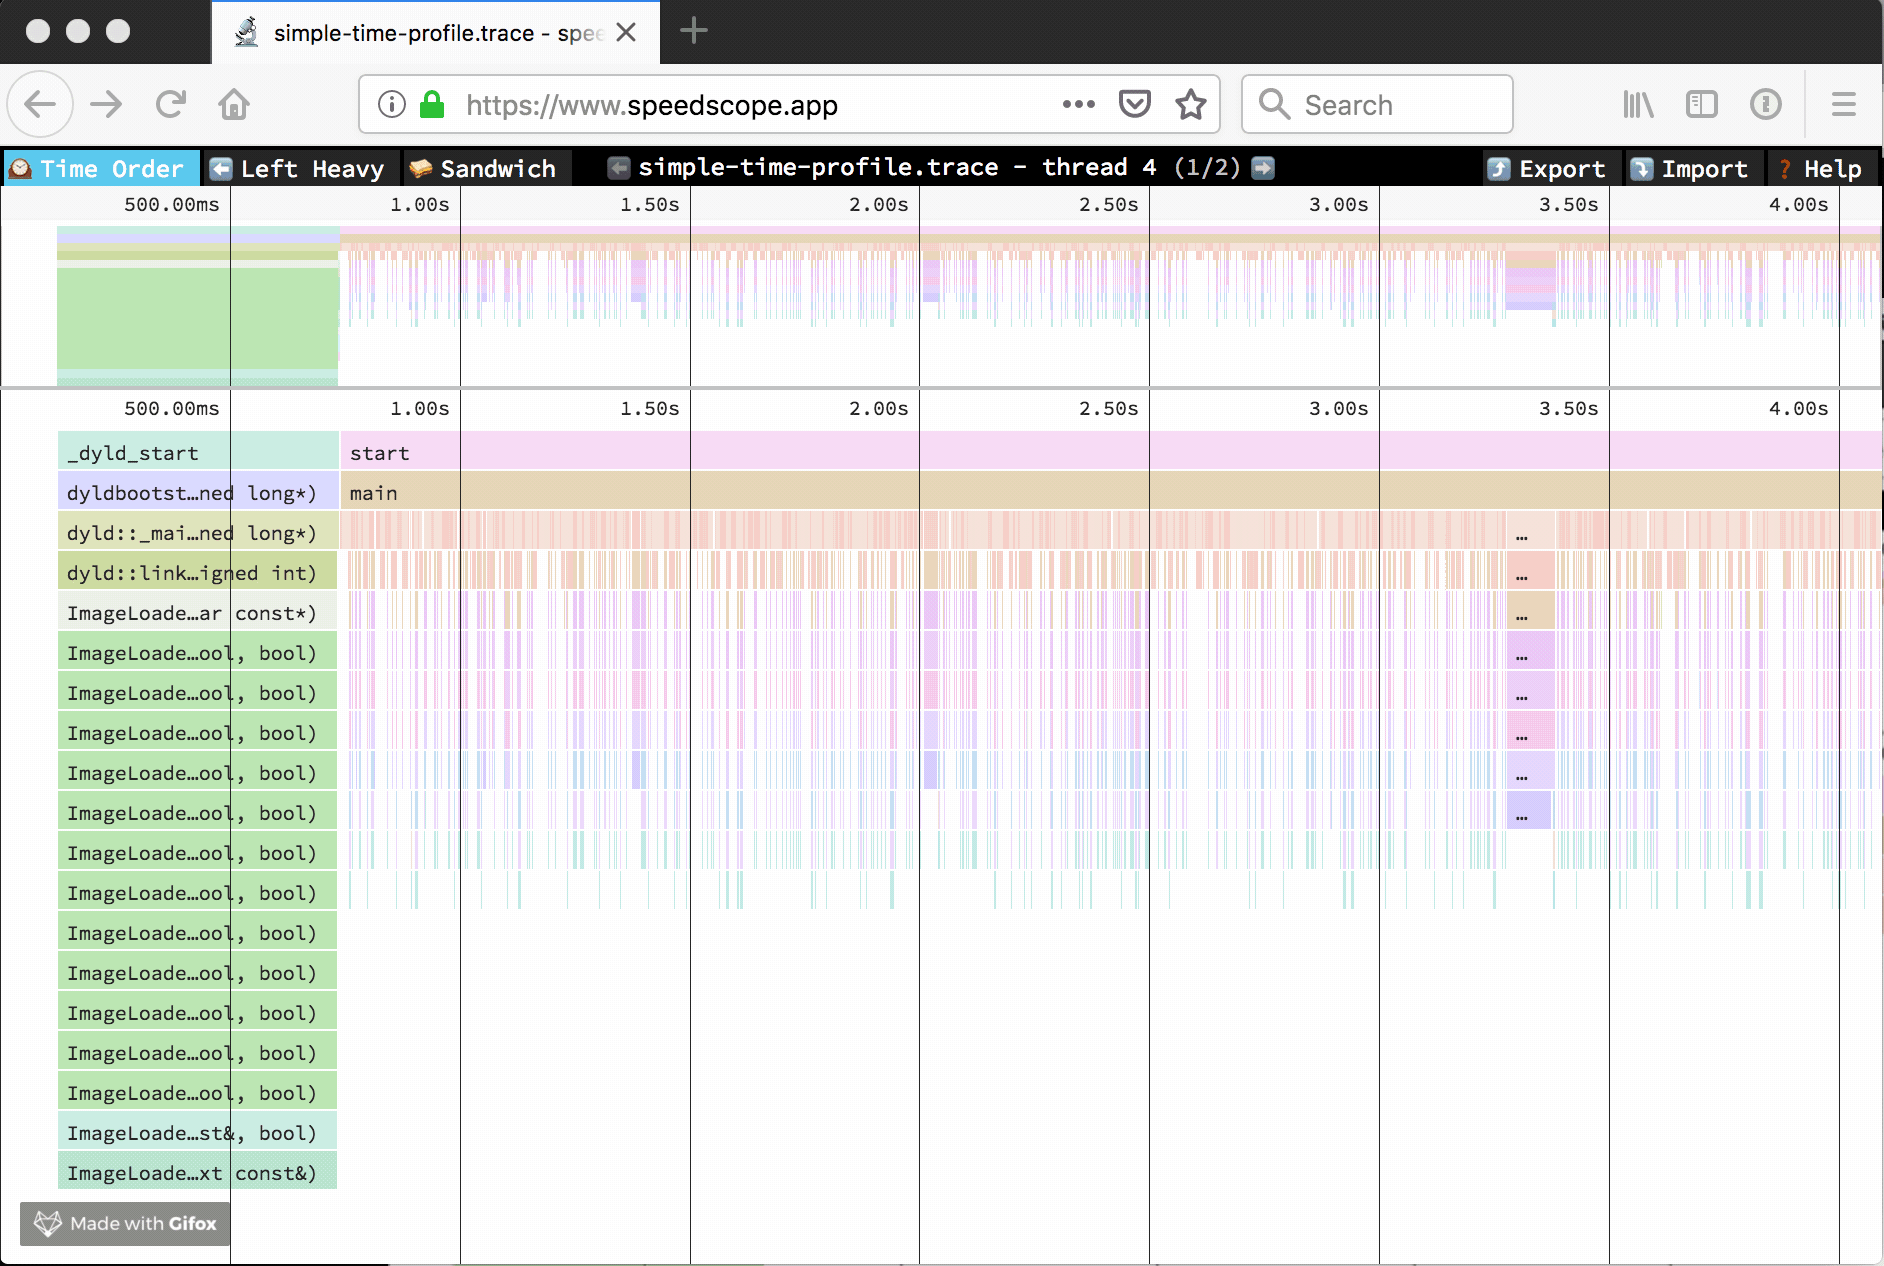
🕰Time Order
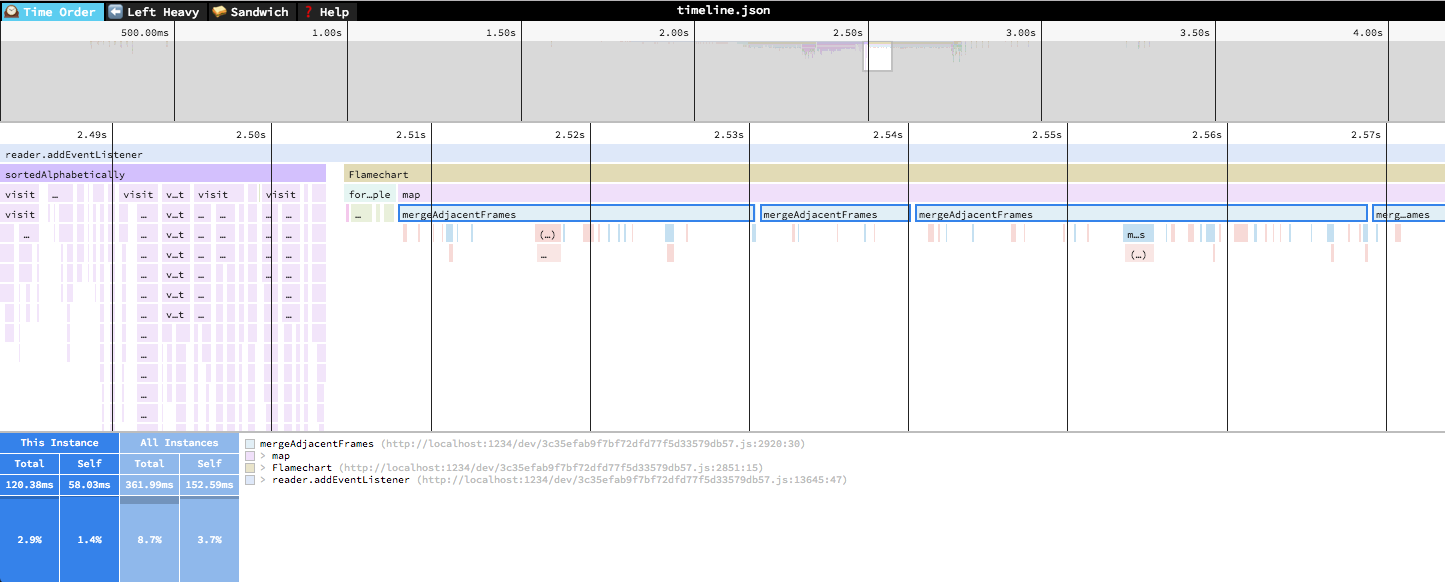
In the “Time Order” view (the default), call stacks are ordered left-to-right in the same order as they occurred in the input file, which is usually the chronological order they were recorded in. This view is most helpful for understanding the behavior of an application over time, e.g. “first the data is fetched from the database, then the data is prepared for serialization, then the data is serialized to JSON”.
The horizontal axis represents the “weight” of each stack (most commonly CPU time), and the vertical axis shows you the stack active at the time of the sample. If you click on one of the frames, you’ll be able to see summary statistics about it.
⬅️Left Heavy
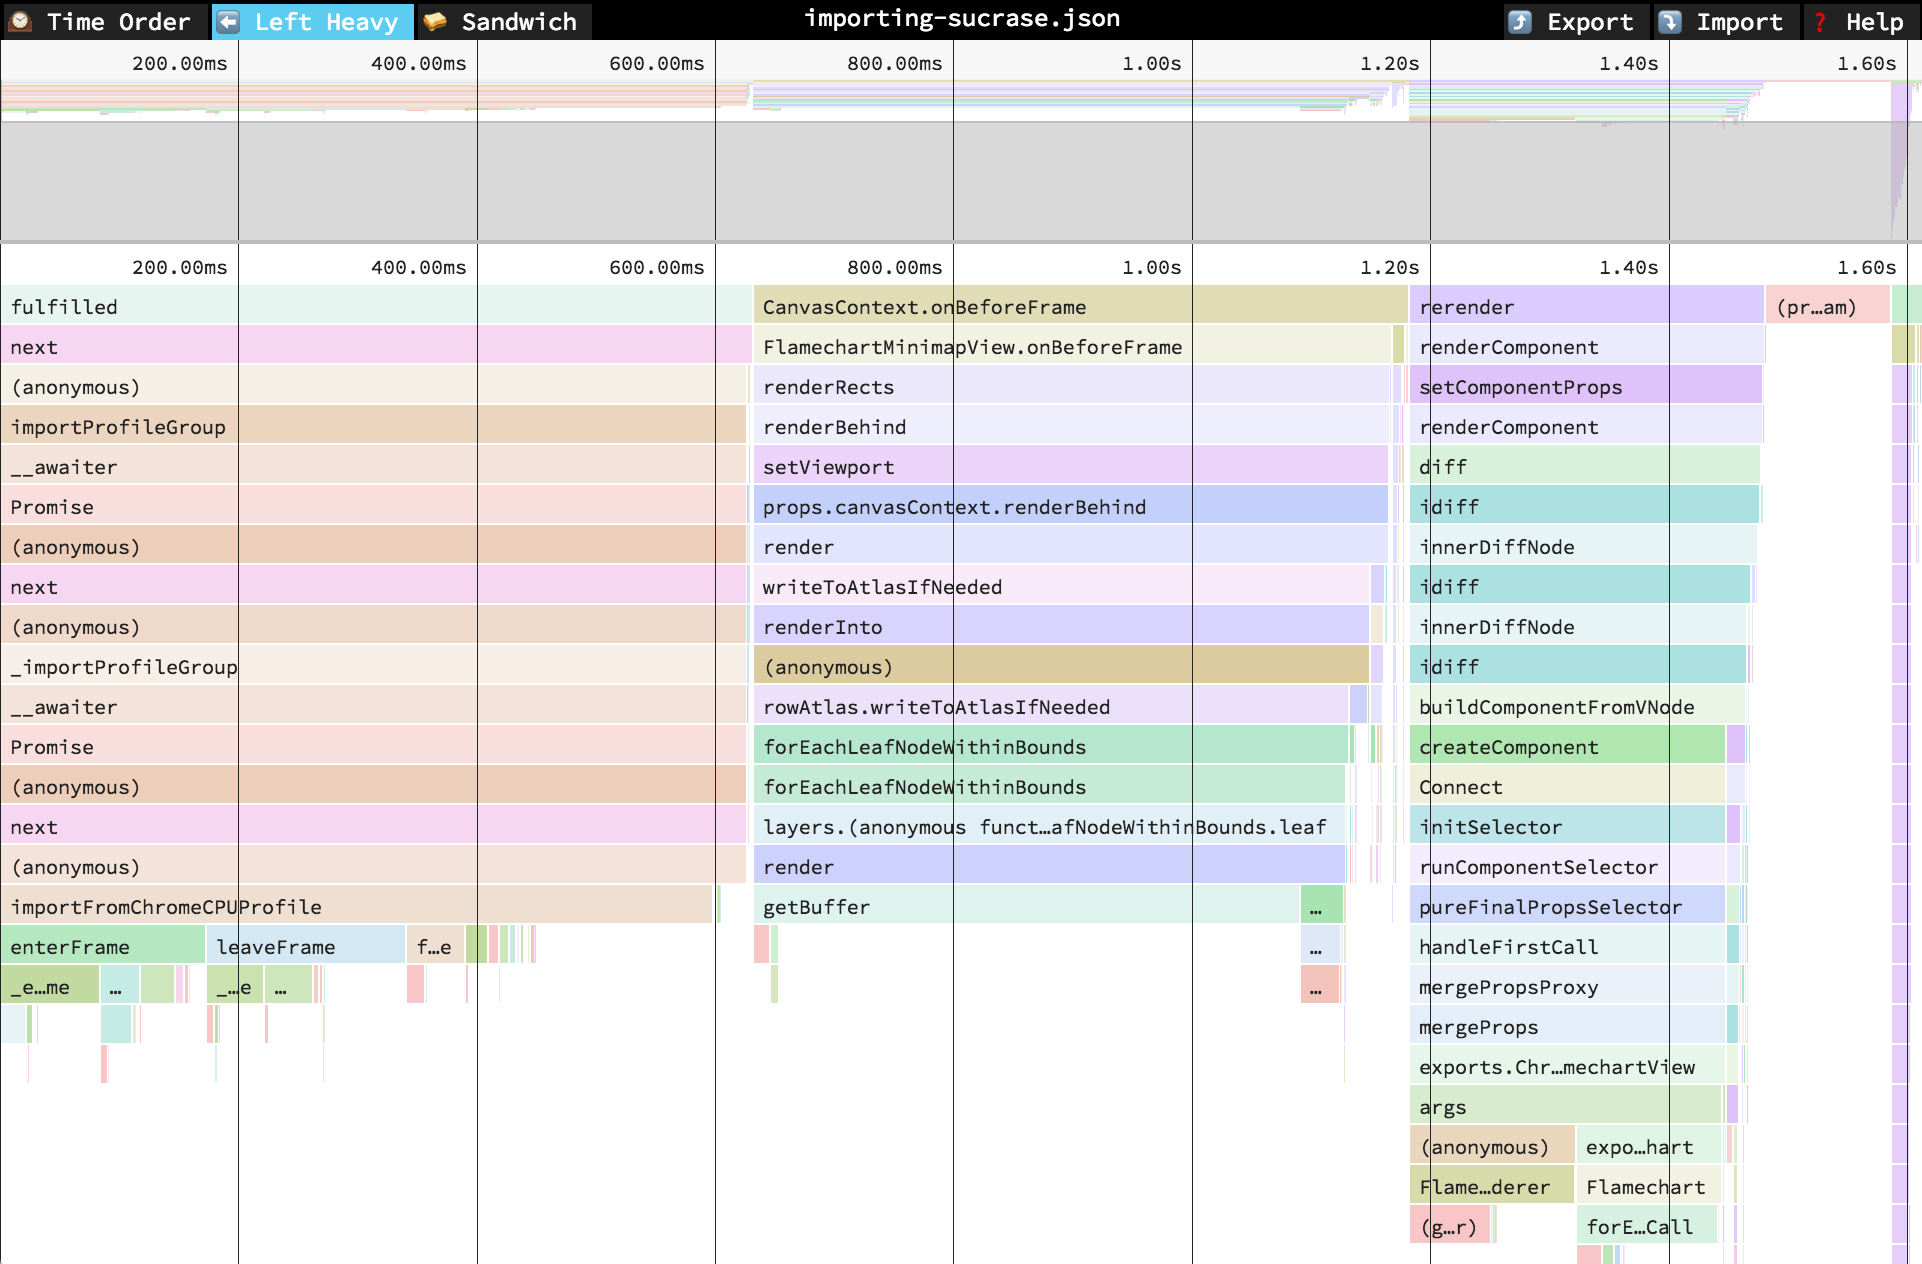
In the “Left Heavy” view, identical stacks are grouped together, regardless of whether they were recorded sequentially. Then, the stacks are sorted so that the heaviest stack for each parent is on the left — hence “left heavy”. This view is useful for understanding where all the time is going in situations where there are hundreds or thousands of function calls interleaved between other call stacks.
🥪 Sandwich
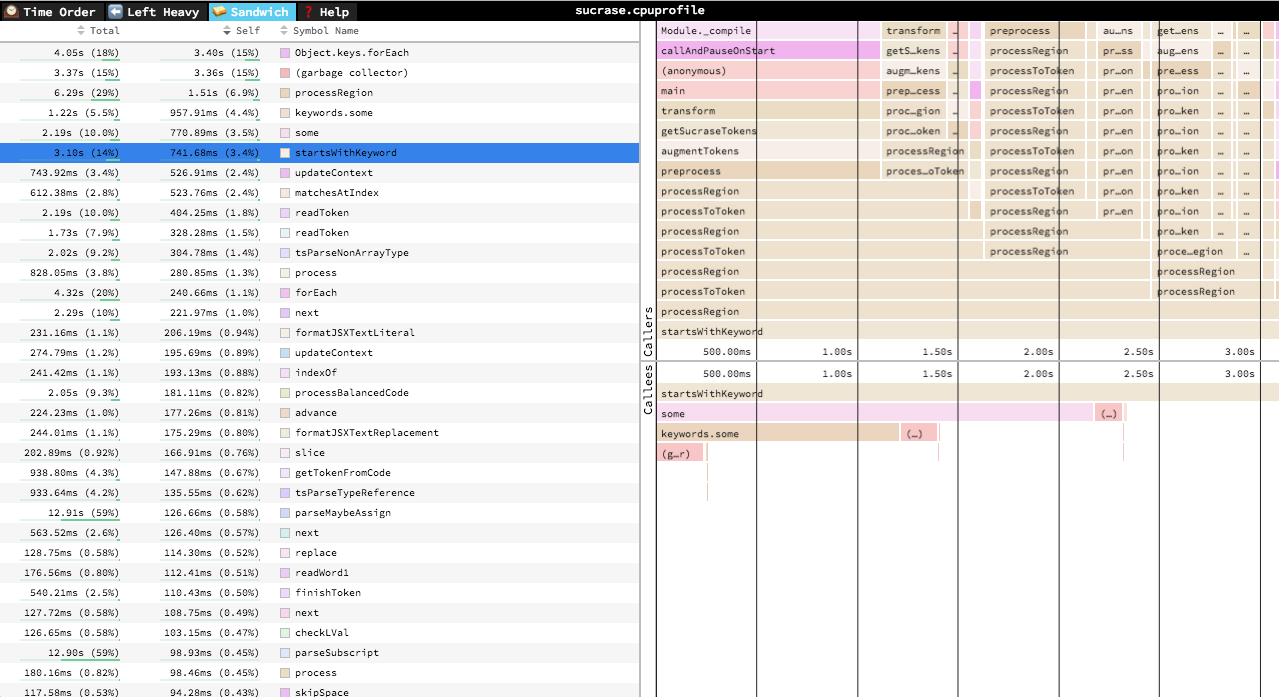
The “Sandwich” view is a table view in which you can find a list of all functions and their associated times. You can sort by self time or total time.
It’s called the “Sandwich” view because if you select one of the rows in the table, you can see flamegraphs for all the callers and callees of the selected row.
Learn more
Up-to-date information about speedscope can be found on the GitHub page: github.com/jlfwong/speedscope. If you run into problems, please let me know by filing an issue!
About Jamie Wong
Jamie is a Canadian engineer currently working on building interface design tools at Figma. He maintains a mostly-technical blog at jamie-wong.com, and is the primary author of speedscope. You can find him on Twitter as @jlfwong.