
Ionic is one of the leading SDK (Software development kit) for hybrid mobile app development in open-source platform. The latest Ionic SDK, Ionic 2 is built on top of AngularJS. Ionic is an open source framework which provides an array of tools and services for unique development of hybrid mobile apps using web technologies like CSS, HTML5, and SasS.
This tutorial showcases how you can render charts in Ionic framework using SQLite which is an embedded SQL database engine. To render charts, we’ll use FusionCharts JavaScript Library.
 Note: Before you run the above command, make sure that you have the android emulator already installed in your system. Please note, the above sample will not get rendered properly in a browser as most of the browsers do not support cordova natively. Thus we recommend to check the application in an emulator, as using Ionic server may not give you the desired output.
If you find any difficulty in rendering the chart or you see any error in your code, click here to download the complete source code of the sample project we have created for this tutorial.
Note: Before you run the above command, make sure that you have the android emulator already installed in your system. Please note, the above sample will not get rendered properly in a browser as most of the browsers do not support cordova natively. Thus we recommend to check the application in an emulator, as using Ionic server may not give you the desired output.
If you find any difficulty in rendering the chart or you see any error in your code, click here to download the complete source code of the sample project we have created for this tutorial.
Table of Contents
Requirements
Before you start, make sure you have the following components on your local machine:- Ionic 2 [Download Link]
- SQLite Plugin [Download Link]
- FusionCharts Suite XT [Download Link]
- FusionCharts Angular 2 Plugin [Download Link]
Step 1: Setting up the Environment
- Install Ionic 2 in your local system. Run the following code in the terminal:
npm install -g ionic cordovaYou can also refer to the documentation page of Ionic 2 from here. - After the installation, create the skeleton of the app. Run the following code in cmd shell to create the skeleton:
ionic start fusiondatabase blankThe above command will install all the dependencies to run a basic project. - Install SQLite plugin. From your CMD shell, get into application directory Reference : c:\ionicprojects\fusiondatabase>
- Once you are in the application directory, run the following command:
ionic cordova plugin add cordova-sqlite-storageNote: To know more, refer to the documentation of SQLite plugin. - app.module.ts file is pre build in the project created. The command mentioned below will import the SQLite class to the app.module.ts file. SQLite class, imports the SQLite native plugin for Ionic 2.
import { SQLite } from '@ionic-native/sqlite'; - Pass the SQLite class in the provider of app.module.ts file. Refer to the code below:
providers: [SQLite, StatusBar, SplashScreen, {provide: ErrorHandler, useClass: IonicErrorHandler} ] - It’s time to import SQLite and SQLiteObject in home.ts file.You’ll get the file in folder named home under src folder [src -> home -> home.ts]. Once done, from the terminal run the command given below:
import { SQLite, SQLiteObject } from '@ionic-native/sqlite'; - Create a reference of the constructor using the following code in your home.ts file
constructor(public navCtrl: NavController,private sqlite: SQLite) { } - Add the FusionCharts angular 2 plugin to your project. Run the following command in your CMD shell:
npm install angular2-fusioncharts --save - The entire
app.module.tslooks like:import { BrowserModule } from '@angular/platform-browser'; import { ErrorHandler, NgModule } from '@angular/core'; import { IonicApp, IonicErrorHandler, IonicModule } from 'ionic-angular'; import { SplashScreen } from '@ionic-native/splash-screen'; import { StatusBar } from '@ionic-native/status-bar'; import { SQLite } from '@ionic-native/sqlite'; import { MyApp } from './app.component'; import { HomePage } from '../pages/home/home'; // Import angular2-fusioncharts import { FusionChartsModule } from 'angular2-fusioncharts'; // Import FusionCharts library import * as FusionCharts from 'fusioncharts'; // Load FusionCharts Charts module import Charts from "fusioncharts/fusioncharts.charts"; // Load themes import themes from "fusioncharts/themes/fusioncharts.theme.fint"; @NgModule({ declarations: [ MyApp, HomePage ], imports: [ BrowserModule, FusionChartsModule.forRoot(FusionCharts, Charts, themes), IonicModule.forRoot(MyApp) ], bootstrap: [IonicApp], entryComponents: [ MyApp, HomePage ], providers: [SQLite, StatusBar, SplashScreen, {provide: ErrorHandler, useClass: IonicErrorHandler} ] }) export class AppModule {}With this, you have set the environment by installing and configuring all the applications required.
Step 2: Setting up the database
It’s time to create the database from where the data will be fetched to render the chart. In yourhome.ts file, copy the code below:
store=[];

label='';
value='';
items1 = [];
items2 = [];
draw()
{

this.sqlite.create({
name: 'data.db',
location: 'default'
})
.then((db: SQLiteObject) => {

//database create section
db.executeSql('CREATE TABLE IF NOT EXISTS singleseries(id INTEGER PRIMARY KEY AUTOINCREMENT,label,value)', {})
.then(() => console.log('Executed SQL'))
.catch(e => console.log(e));

//data insert section
db.executeSql('INSERT INTO singleseries VALUES(?)', [this.label,this.value])
.then(() => console.log('Executed SQL'))
.catch(e => console.log(e));
this.store=[];
this.items1 = [];
this.items2 =[];
this.items1.push({label: 'Java'});
this.items2.push({value: '36435'});
this.items1.push({label: 'JavaScript'});
this.items2.push({value: '28855'});
this.items1.push({label: 'PHP'});
this.items2.push({value: '24358'});
this.items1.push({label: 'SQL'});
this.items2.push({value: '18072'});
this.items1.push({label: 'C#'});
this.items2.push({value: '11648'});
this.items1.push({label: 'C++'});
this.items2.push({value: '8455'});
this.items1.push({label: 'Python'});
this.items2.push({value: '7760'});
this.items1.push({label: 'C'});
this.items2.push({value: '7359'});
this.items1.push({label: 'Shell'});
this.items2.push({value: '7359'});

 for(var i = 0; i < this.items1.length; i++) {
  var dataset={
    label :this.items1[i].label,
    value :this.items2[i].value
     }
  this.store.push(dataset);
 }
 }
Step 3: Preparing the Chart Data Source
It’s time to prepare the data source for the chart to be rendered. Refer to the code given below:this.dataSource = {
"chart": {
"caption": "Widely used Programming languages",
"paletteColors": "#FFFFFF",
"bgColor": "#141B28",
"bgAlpha": "70",
"showBorder": "0",
"showCanvasBorder": "0",
"canvasbgcolor": "#141B28",
"canvasBgAlpha": "0",
"baseFontColor": "#ffffff",
"usePlotGradientColor": "0",
"plotBorderAlpha": "10",
"placeValuesInside": "0",
"plotspacepercent": "40",
"outCnvBaseFontsize": "15",
"axisLineAlpha": "25",
"yaxismaxvalue": "45000",
"formatnumberscale": "1",
"showxaxisline": "1",
"xaxislinecolor": "#ffffff",
"toolTipColor": "#ffffff",
"toolTipBorderThickness": "0",
"toolTipBgColor": "#000000",
"toolTipBgAlpha": "80",
"toolTipBorderRadius": "2",
"toolTipPadding": "5"
},
"data": this.store
}
this.visible = true;
}, (err) => {
alert('Unable to execute sql: '+JSON.stringify(err));
});
})
.catch(e => console.log(JSON.stringify(e)));
}
By following the steps mentioned above, you are ready with your home.ts file with all the required code:
import { Component } from '@angular/core';
import { NavController } from 'ionic-angular';
import { SQLite, SQLiteObject } from '@ionic-native/sqlite';
@Component({
selector: 'page-home',
templateUrl: 'home.html'
})
export class HomePage {
dataSource: Object;
visible: boolean = false;
constructor(public navCtrl: NavController,private sqlite: SQLite) {
}
store=[];
label='';
value='';
items1 = [];
items2 = [];
draw()
{
this.sqlite.create({
name: 'data.db',
location: 'default'
})
.then((db: SQLiteObject) => {
//database create section
db.executeSql('CREATE TABLE IF NOT EXISTS singleseries(id INTEGER PRIMARY KEY AUTOINCREMENT,label,value)', {})
.then(() => console.log('Executed SQL'))
.catch(e => console.log(e));
//data insert section
db.executeSql('INSERT INTO singleseries VALUES(?)', [this.label,this.value])
.then(() => console.log('Executed SQL'))
.catch(e => console.log(e));
//data retrieve section
db.executeSql('select * from singleseries', {}).then((data) => {
this.store=[];
this.items1 = [];
this.items2 =[];
this.items1.push({label: 'Java'});
this.items2.push({value: '36435'});
this.items1.push({label: 'JavaScript'});
this.items2.push({value: '28855'});
this.items1.push({label: 'PHP'});
this.items2.push({value: '24358'});
this.items1.push({label: 'SQL'});
this.items2.push({value: '18072'});
this.items1.push({label: 'C#'});
this.items2.push({value: '11648'});
this.items1.push({label: 'C++'});
this.items2.push({value: '8455'});
this.items1.push({label: 'Python'});
this.items2.push({value: '7760'});
this.items1.push({label: 'C'});
this.items2.push({value: '7359'});
this.items1.push({label: 'Shell'});
this.items2.push({value: '7359'});
for(var i = 0; i < this.items1.length; i++) {
var dataset={
label :this.items1[i].label,
value :this.items2[i].value
}
this.store.push(dataset);
}
this.dataSource = {
      "chart": {
        "caption": "Widely used Programming languages",
          "paletteColors": "#FFFFFF",
          "bgColor": "#141B28",
          "bgAlpha": "70",
          "showBorder": "0",
          "showCanvasBorder": "0",
          "canvasbgcolor": "#141B28",
          "canvasBgAlpha": "0",
          "baseFontColor": "#ffffff",
          "usePlotGradientColor": "0",
          "plotBorderAlpha": "10",
          "placeValuesInside": "0",
          "plotspacepercent": "40",
          "outCnvBaseFontsize": "15",
          "axisLineAlpha": "25",
          "yaxismaxvalue": "45000",
          "formatnumberscale": "1",
          "showxaxisline": "1",
          "xaxislinecolor": "#ffffff",
          "toolTipColor": "#ffffff",
          "toolTipBorderThickness": "0",
          "toolTipBgColor": "#000000",
          "toolTipBgAlpha": "80",
          "toolTipBorderRadius": "2",
          "toolTipPadding": "5"
      },
      "data": this.store
    }

this.visible = true;

}, (err) => {
alert('Unable to execute sql: '+JSON.stringify(err));
});
})
.catch(e => console.log(JSON.stringify(e)));
}
}
Step 4: Creating FusionCharts Directive
Include FusionCharts directive insidehome.html file located in home folder under src folder. [Reference path: src → home→ home.html]
Refer to the following code which will already be present in home.html file:
<ion-content padding>
<button ion-button color="danger" (click)="draw()" > Draw Chart </button>
<fusioncharts
          *ngIf="visible"
          width="100%"
          height="500"
          type="Bar2D"
          dataFormat="JSON"
          [dataSource]="dataSource">

      </fusioncharts>
</ion-content>
Step 5: Building the application
Now that we are done with the coding, it’s time to build the application. We will be working with android application (you can also build the application for iOS). Run the following command in your CMD shell:ionic cordova build android
This command builds all the files for your application automatically.
Note: Please make sure you have cordova plugin installed in your system
Step 6: Running the app
All set? It’s time to render the chart in your application. Just copy the command stated below and run it in your CMD shell:ionic cordova android run
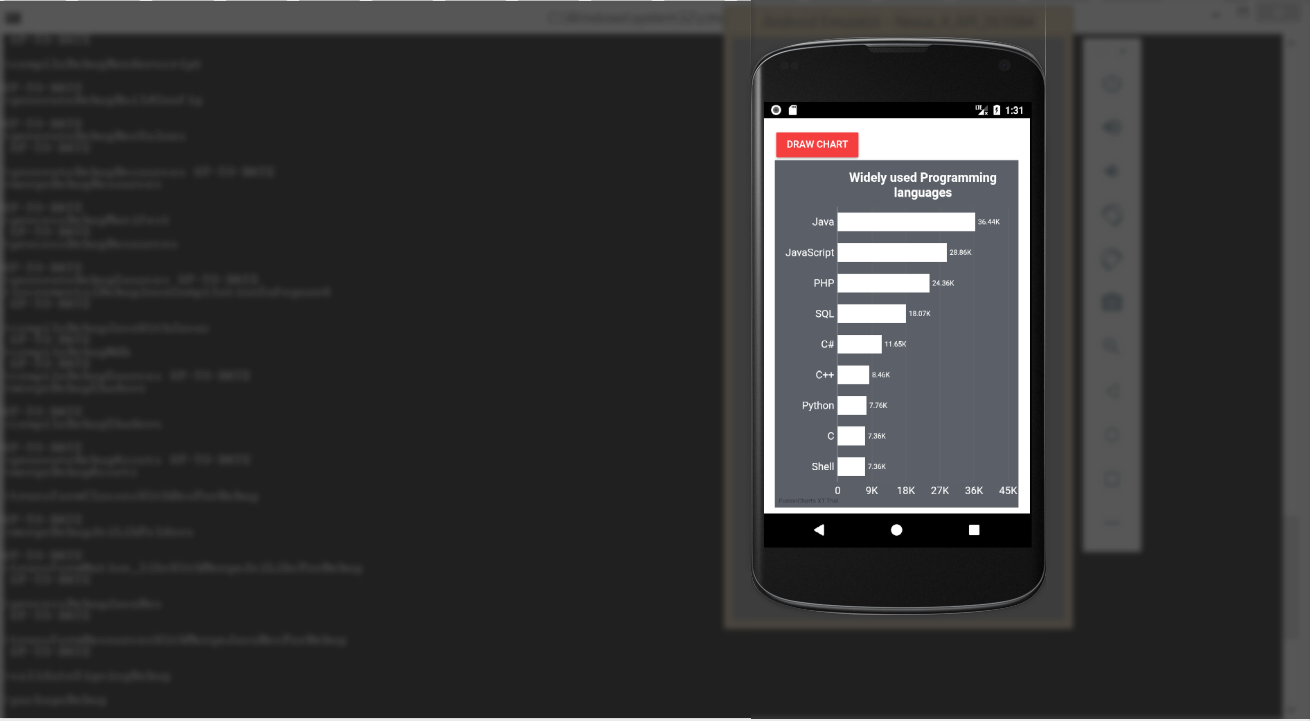
Running the above command will open your emulator and deploy the application. The output looks like:
Note: Before you run the above command, make sure that you have the android emulator already installed in your system. Please note, the above sample will not get rendered properly in a browser as most of the browsers do not support cordova natively. Thus we recommend to check the application in an emulator, as using Ionic server may not give you the desired output.
If you find any difficulty in rendering the chart or you see any error in your code, click here to download the complete source code of the sample project we have created for this tutorial.